Using Vortexa’s SDK to investigate the quality of crude imported into Northwest Europe
An investigation into crude imported into Northwest Europe using Vortexa’s Python SDK.
On the 27th May, Product Specialist Amy Lees and Machine Learning Engineer Christos Hadjinikolis analysed the quality of crude imported into the ARA (Amsterdam Rotterdam Antwerp) region, a key refining hub in Northwest Europe, using Vortexa’s Software Development Kit (SDK).
Their analysis sheds light on how the API and sulphur content of crudes imported into the ARA region, underpinning refinery yields, is changing with time. A lighter crude slate yields higher volumes of light and middle distillates compared to a heavier one, which yields more heavy residues.
ARA is the key refining hub of North West Europe and therefore an important crude importer. It is also the key producer of European products, and via the links to inland waterways sends products (such as gasoline and diesel) all over Europe. The amount of different products that a refinery can produce is directly correlated to the quality of the crudes going into it; a lighter, sweeter crude being refined will produce more gasoline and light end products which are more valuable, whereas a heavier crude will result in more fuel oil and residuals.
Watch the webinar and access the below notebook via our SDK here.
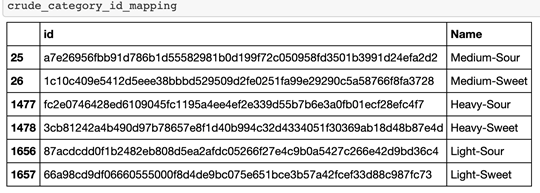
Let’s start by analysing the crude imports into the ARA region by quality across a time period. Vortexa groups the global crude grades into six categories based on their API and sulphur content – Light-Sweet, Medium-Sweet, Heavy-Sweet, Light-Sour, Medium-Sour and Heavy-Sour.
The first step is to get the ID of each of the crude categories by calling them from the Products endpoint within the SDK:
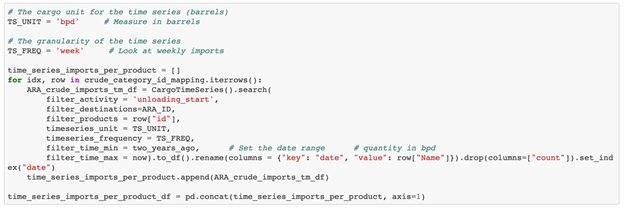
Next, the Cargo Time Series endpoint is used to get the volume of crude imported into ARA in each crude category on a weekly basis.
By plotting this data on a chart, it is clear that the light-sweet and medium-sour crudes were the top two crude categories imported into the ARA region in the past two years. Further data reveals that West Texas Intermediate (WTI) and North Sea blends (i.e. Beryl and Ekofisk) top the light-sweet grades, while Urals and Arab Light top the medium-sour grades.
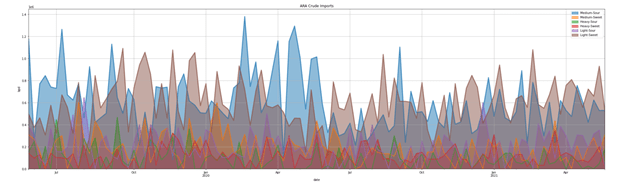
More Medium-Sour crude was also seen imported into the ARA region between February and June 2020, as surplus crude from a global demand collapse coupled with additional supplies from OPEC+ before its May 2020 production cuts, made its way into the ARA storage. As OPEC+ crude supplies tightened post May 2020, Light-Sweet crude volumes into ARA rebounded.
The first graph indicates that there is an influx of Medium-Sour crude coming into ARA between March and May 2020. This coincides with the period of time where OPEC+, especially Saudi Arabia and Russia, were unable to agree on supply cuts and flooded the market with their crudes, causing the price of Medium-Sour crudes to decrease dramatically. Therefore, it makes sense that during this period a key refining hub would import this cheaper, Medium-Sour crude instead of other grades.
After May 2020, OPEC+ imposed cuts on their crude oil production which lead to an increase in the price of Medium-Sour crude. Since then, there has been more Light-Sweet crude imported into ARA as it was readily available and cost efficient.
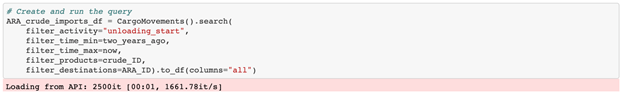
Let’s investigate using the Cargo Movement endpoint how the average API and sulphur levels of crude imported into the ARA region have changed, based on the quantities of specific grades discharged during this period.
This code shows the interrogation of the Cargo Movements endpoint and how this is combined with a dataframe we can get from the Products endpoint that has the average sulphur and average API for each crude grade.
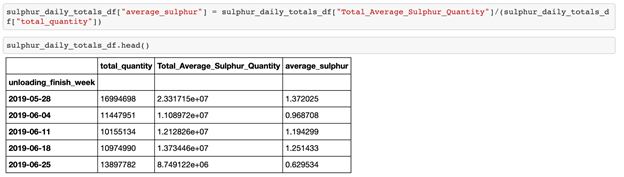
Using the cargo movements results, the volume weighted average API and sulphur of crude discharging into the ARA region is calculated. The importance of using a volume weighted average can be illustrated using the example below, showing the normalised versus unnormalised results. Although this difference may seem small, its magnitude is amplified when based on total crude volumes arriving into the ARA region.
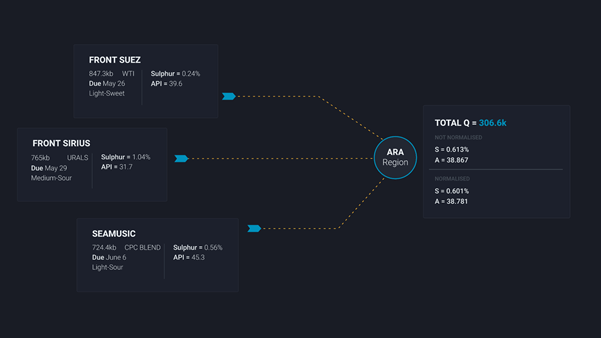
The table below shows Total Quantity (crude imported to ARA weekly), Total Average Sulphur Quantity (sum of volume multiplied by sulphur on a cargo basis) and the Average Sulphur (average sulphur quantity / total volume).
Plotting the data on a chart, there is a decline in the average sulphur and API content of crude discharged into the ARA region respectively, underpinned by the rise in Light-Sweet and decline in Medium-Sour crude arrivals between January and May 2020.
A further rise in Light-Sweet crude imports into the ARA region relative to other crude categories at the start of this year has further accentuated the trend of lower sulphur and higher API content of crude discharging into the region. Demand for Light-Sweet crudes have risen as refiners seek to increase gasoline and diesel straight-run production, without the need to operate more expensive upgrading units in the refinery.
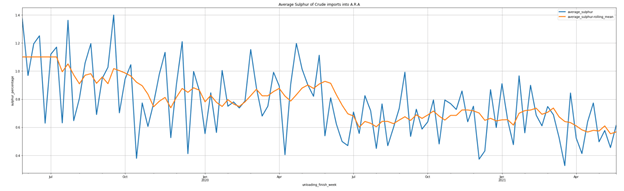
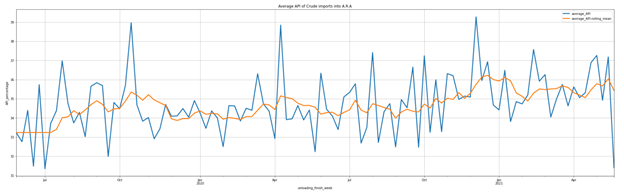
Overall, this investigation highlights the value-add of Vortexa’s SDK in the analysis of crude imports into the ARA region. A further deep-dive into the moving average API and sulphur content of crudes into the region is made possible using the SDK.
—
Want to get the latest updates from Vortexa’s analysts and industry experts directly to your inbox?
{{cta(‘cf096ab3-557b-4d5a-b898-d5fc843fd89b’,’justifycenter’)}}
More from Vortexa Analysis
- Jun 4, 2021 North American LPG shipments to Asia face pressure
- June 2, 2021 China’s new consumption tax turns tide of gasoline and diesel exports
- Jun 2, 2021 Suezmax tankers infiltrate Europe-bound transatlantic crude flows
- May 27, 2021 European naphtha exports boost LR2 demand
- May 26, 2021 Diverging trends behind stable supertanker utilisation
- May 26, 2021 US DPP imports climb amid rising gasoline demand


