Upskill & unlock more of Vortexa’s data using our SDK
Upon launch of the Vortexa Academy, we go through one of the Jupyter notebooks extracting data for cargo movements.
Our flagship course on Vortexa Academy is Python for the Energy Industry. It covers the basics of Python, beginning at installation and getting started, as well as how to use the Pandas and NumPy libraries.
The course progresses into the Vortexa SDK; how to use it to look at cargo movements; aggregated cargo time series data and more advanced analytics including hypothesis testing and predictive modelling. Jupyter notebooks are provided to accompany the videos and support students’ learning and can be accessed either online or locally.
This blog will demonstrate one of the course notebooks to show you the powerful ability of the Vortexa SDK and how it can assist in daily analytics and trading decisions.
We will look at Notebook 29: Working with Aggregated Cargo Movements Data (this references the Cargo Movements endpoint which can be found here).

Vortexa’s SDK is a powerful tool to evaluate multiple scenarios. Let’s look at US crude exports for the 7 weeks to the end of 2020, in barrels.
In the extract from the script above you can see that we find the ID for the US in the geographies endpoint (documentation here) and the Crude ID in the products endpoint (documentation here).
Next, we decide what columns we want for these relevant cargo movements (a full list of columns can be found on the documentation for the cargo movements endpoint). We rename these columns so that our dataframe is a bit easier to understand, then we set up the search for the US crude exports from the Cargo Movements endpoint.
Now we’ll have every movement which took place in the 7 weeks to the end of 2020. To better see trends, we’ll organise at the data on a weekly basis by looking at the ‘loading finish’ column in our dataframe and group these weekly under a new column called ‘loading week’.
We then plot this on a graph to see the trends in US exports. The code extract below shows the code used to plot the data on a bar chart and label the axis.

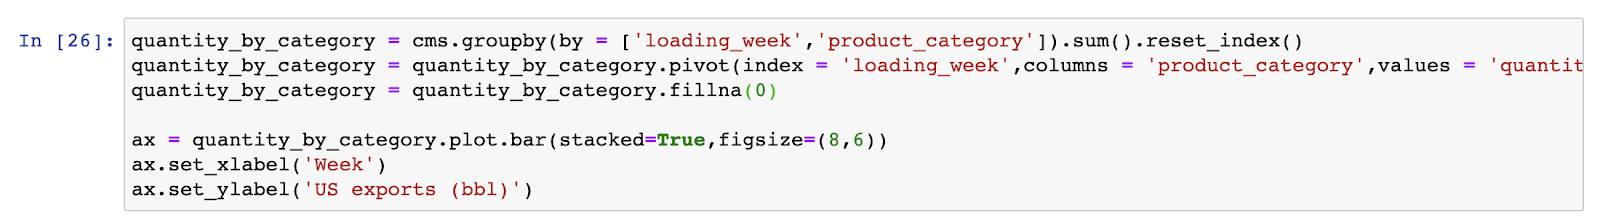
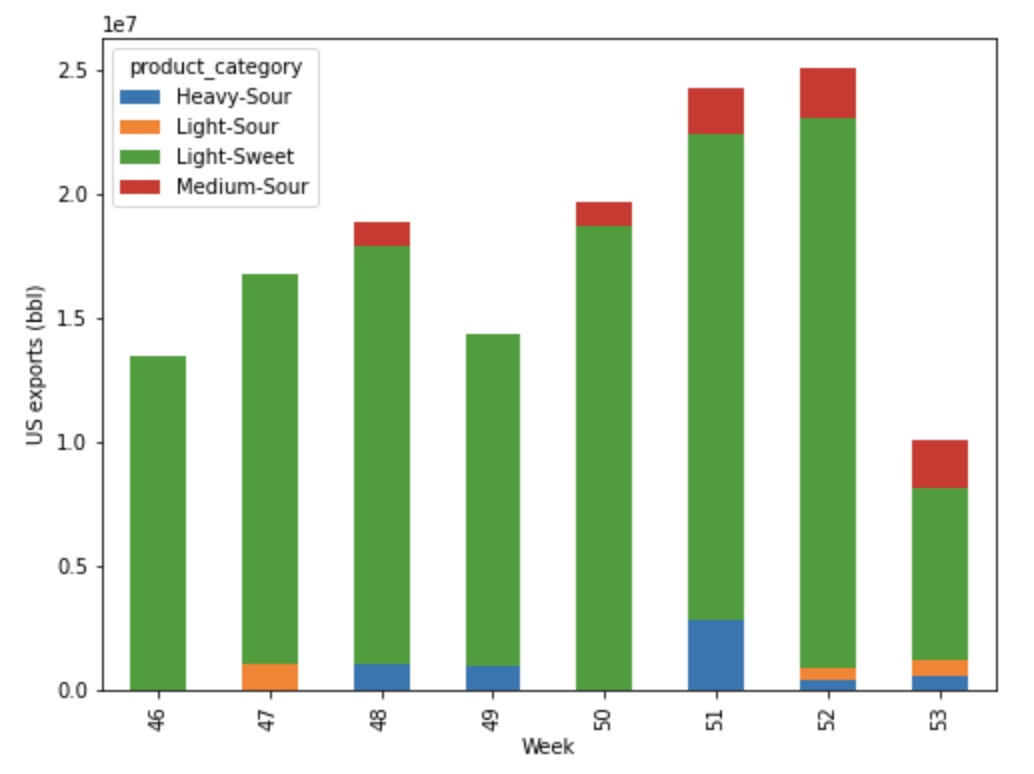
The data extracted from the cargo movements search will separate the movements by crude category and grade. We could plot this to see the comparisons of types of crude exported from the US – and as you would expect you see the largest category is Light-Sweet.
We can see how this is queried using the second extract, grouping the data by loading week and the category (which will separate it by heavy/medium/light and sweet or sour). Once sorted, we can plot this on a stacked bar chart.

Another way to present this data using the Cargo Movements output is looking at the destination countries of the US crude exports. To do this, we group by unloading country and sort in ascending order before removing the countries which only take a small amount of cargo. We remove these countries in order to make the pie chart easier to understand, and leave us only with the largest destinations of US Crude – that is, the key trade flows. To clearly analyse and compare, we can transform it into percentages and convert to a pie chart.
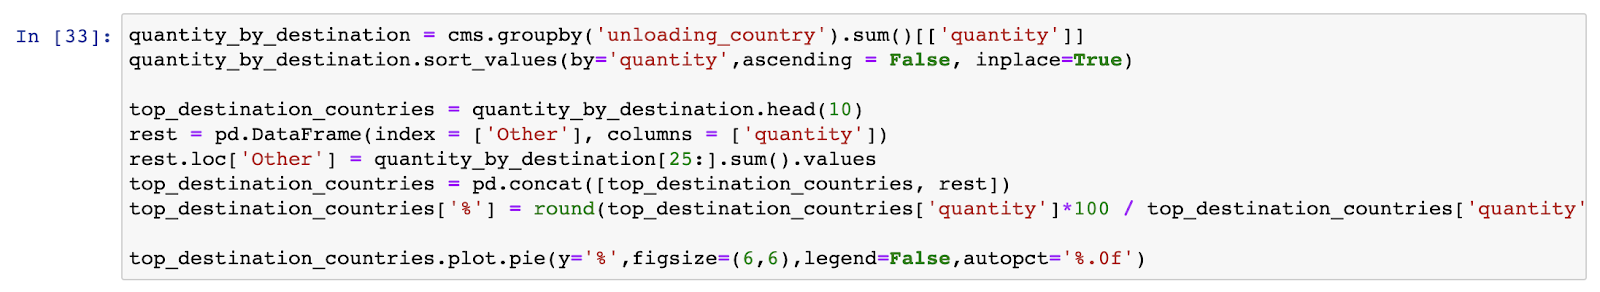

As you can see above, based on seaborne flows alone, India takes the largest quantity of US Crude over this period of time. Canada, the Netherlands, China and the UK make up the rest of the top 5. It can also be interesting to compare these top countries over longer time frames to see how changing market conditions impact flows and the crude slates of these key refining regions.
The SDK can be used to solve any number of problems or questions traders and analysts might have about oil, gas, energy and freight markets, and can help present this information graphically or tabularly. If used effectively, the SDK can offer rich insights in addition to the web-based platform, as it can allow you to compare multiple flows in one table or to look at a longer time series in one go.
Vortexa Academy is an exciting new endeavour that provides Vortexa clients exclusive access to courses aimed at upskilling in Python and Analytics. The courses are curated by industry professionals, using industry-relevant tools and examples, thereby providing an edge and point of difference to all other Python courses available.
About the author

Amy is a Product Specialist in the London team looking after customer success within EMEA, as well as being an Instructor for Vortexa Academy. Prior to joining Vortexa, Amy worked at BP on their Trader Development Program, with rotations in Crude Oil Derivatives and Middle Distillate Barge Operations. She also interned at Gazprom Marketing and Trading on the Retail Gas desk.
Discover more about our new initiative with Vortexa Academy, including our Python for the Energy Industry course.
{{cta(‘42654005-20e6-467c-a421-01e07d8135ae’,’justifycenter’)}}


