Mediterranean Aframax rates enter summer lull in the doldrums
Mediterranean Aframax rates enter summer lull in the doldrums
The summer lull, a traditional harbinger of reduced activity in the crude tanker markets, is now in full swing. Aframax tankers trading in the Mediterranean are entering this period with rates already at multi-year lows, amid low cargo volumes and a build in surplus tonnage. We investigate the current state of the Aframax Mediterranean market and look to where it is heading through Vortexa data.


Aframax fleet utilisation for cross-Mediterranean voyages
Ton-mile demand, utilisation plummets
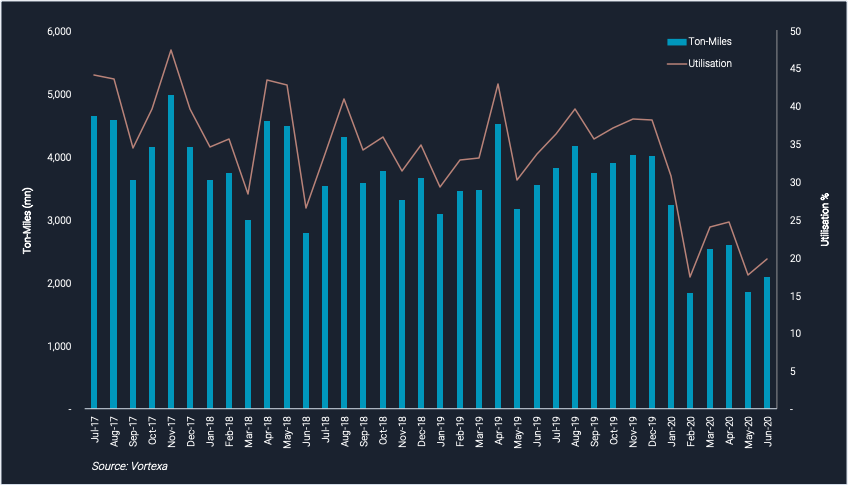
- At its highest level in November 2017, ton-mile demand stood at 4,971 mn ton-miles for cross-Mediterranean Aframax voyages. For the same month, utilisation of the Aframax fleet stood close to 50%, based on all tankers having traded in the region in the last 3 years.
- The situation has since evolved dramatically with the removal of Libyan crude exports, as well as a lacklustre demand environment.
- As of the end of June 2020, ton mile demand had dropped below 2,083 mn ton-miles and utilisation of the fleet below 20% – more than halved from previous highs.
- The combined effect of a fall in ton-mile values for Mediterranean crude cargoes as a measure of demand, and a fall in utilisation, has gone hand-in-hand with an increase in tonnage in the region, leading to the current weakness in the Aframax tanker market.
A continuous fall in cargo counts
- Vortexa data shows 4.83mn mt, or the equivalent of 56 Aframax cargoes, seaborne as of July 2017 for a cross-Mediterranean voyage. As of July 2020, the number of Aframax cargoes has fallen by 80% to just 11. Little fixing activity has also led to freight rates dropping to multi-year lows.


Top 5 cross-Mediterranean crude exports (b/d)
Libya turns the taps off
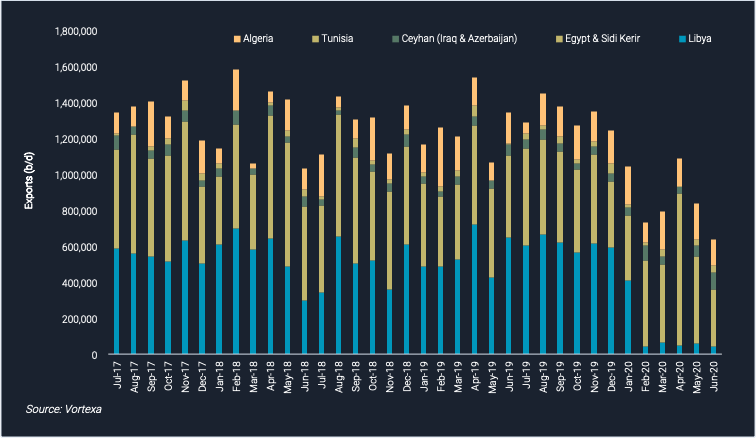
- Libyan exports drove Mediterranean crude export activity before the near suspension of exports from the country’s main terminals at the beginning of this year, as we see in our data.
-
- In October 2018, Libyan crude exports totalled around 1.2mn b/d. As of June 2020, total crude exports (excluding condensate) were below 50,000 b/d, a drop of close to 100% since the height of its recent exporting power.
- The loss of Libyan crude exports from a freight perspective translates to drop in activity from 14 Aframaxes a week to just one Aframax every other week at today’s output.
- In October 2018, Libyan crude exports totalled around 1.2mn b/d. As of June 2020, total crude exports (excluding condensate) were below 50,000 b/d, a drop of close to 100% since the height of its recent exporting power.
Plugging the gap?
- Other regional crude exporters have failed to fully fill the void left by the removal of Libyan exports, while the OPEC+ coalition agreement to curtail production also limited any growth in Algerian volumes.
- The repercussions have been felt strongly throughout the Aframax tanker market with cross-Mediterranean freight rates reaching multi-year lows according to market participants.


See this view live in our platform
Looking ahead
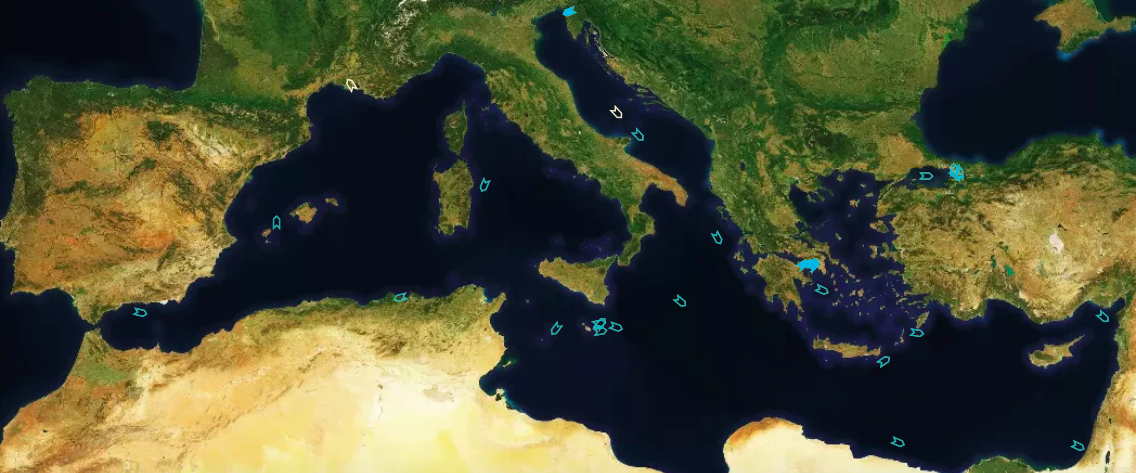
- Vortexa data, as of 14 July 2020, showed 31 Aframax tankers ballasting within the Mediterranean, down from the average (since July 2017) of 43 tankers involved in cargo movements at any given time.
- The drop in tonnage reflects owners moving ships out of the region to seek higher earnings elsewhere. Market participants expect tanker rates to remain deflated given the lack of cargoes currently available for loading.
- This could change however if Libya were to resume exports on a more consistent basis, as additional crude cargoes would provide shipowners with the highly sought-after stimulus to tanker rates.
Interested in a more detailed view of our data?
{{cta(‘bed45aa2-0068-4057-933e-3fac48417da3′,’justifycenter’)}}