Voyages Data use case: post route ballast distribution
Join one of our Freight Analysts as we do a deep dive into the code behind one of our use cases for the new Voyages dataset.
Introduction
Our Freight team has created a use case for our Voyages dataset which allows clients to track the behaviour of ballast vessels after discharging on a specific route: the post-route ballast distribution. The output shows counts as well as proportions of post-route ballast legs that head to different destinations after discharging. This can help traders and charterers track supply patterns of vessels and make informed decisions about freight rate movements and vessel supply dynamics in the market. The time series presentation of this solution also allows clients to track any changes in vessel behaviour in order to update any assumptions made when trading/chartering. That said, few things are better explained without the use of an example, so here goes.
Applied example
Assumption: On all routes, a vessel will discharge and ballast back to its origin to load again and repeat.
Our post-route ballast distribution can help to test this, and see to what extent it is true or false. In this example, we’ll look at two routes: TC2 (Europe-to-US Atlantic Coast gasoline on MR tankers) and TD3C (Middle East-to-China crude on VLCCs).
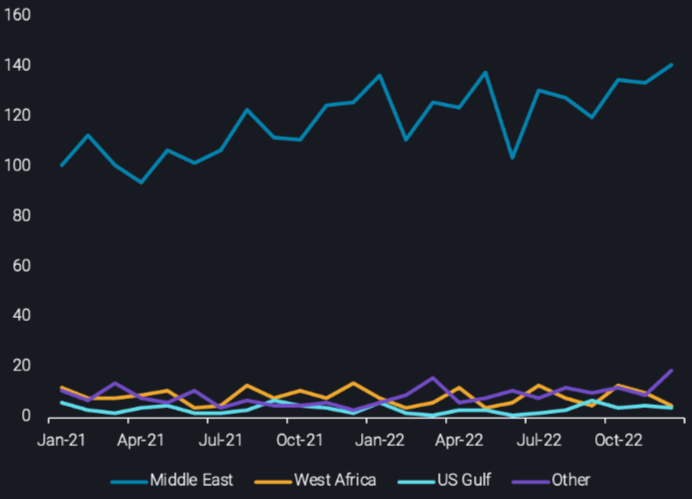
Post-route ballast distribution for TD3C (voyage counts)
Clearly, for TD3C, our assumption is partially true, however the data does highlight other ballast destinations.
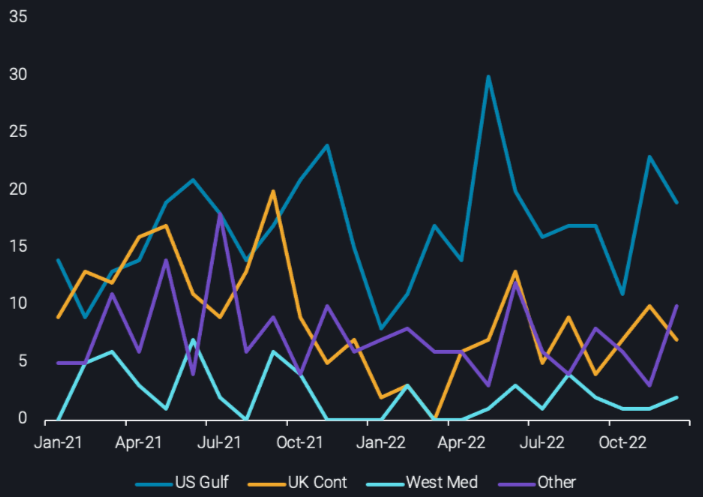
Post-route ballast distribution for TC2 (voyage counts)
However, for TC2, our assumption is not true, clearly vessels travel to a diverse set of destinations after discharging in PADD 1. In fact, they are more likely to ballast to the US Gulf to load diesel to take to Europe, this is an example of triangulation. Using our assumption above could lead to potential overestimation of vessel supply in Europe as well as overestimation of the average ballast mileage attached to this voyage.
The code
Now that we have described the use case and applied an example, let’s dive into the SDK code that produces this output. We will focus on the most important parts of the code, specifically, we will focus on the function.
Head over to our VorTECHsa blog to learn more here.


