The power of Vortexa’s new regional scheme
Vortexa has recently released a new set of shipping region polygons that will empower flow, supply/demand, inventory, freight and arbitrage analysis. Chief Economist David Wech talks about this exciting new toolset, the underlying motivation and rationale, and illustrates a couple of use cases.
2, 8, and 24 are the magic figures when it comes to the new Vortexa shipping regions. As a two-decade supply/demand analyst, when I joined Vortexa one of the first things was to acquaint myself with the existing regional schemes. And there was a bit of work to do. We had 33 shipping regions and 36 trading regions with widespread but overall small differences in the definitions. Also polygons were drawn from a seaborne perspective, leaving some holes in the landmass, which had to change latest with the arrival of onshore crude inventories in the service portfolio.
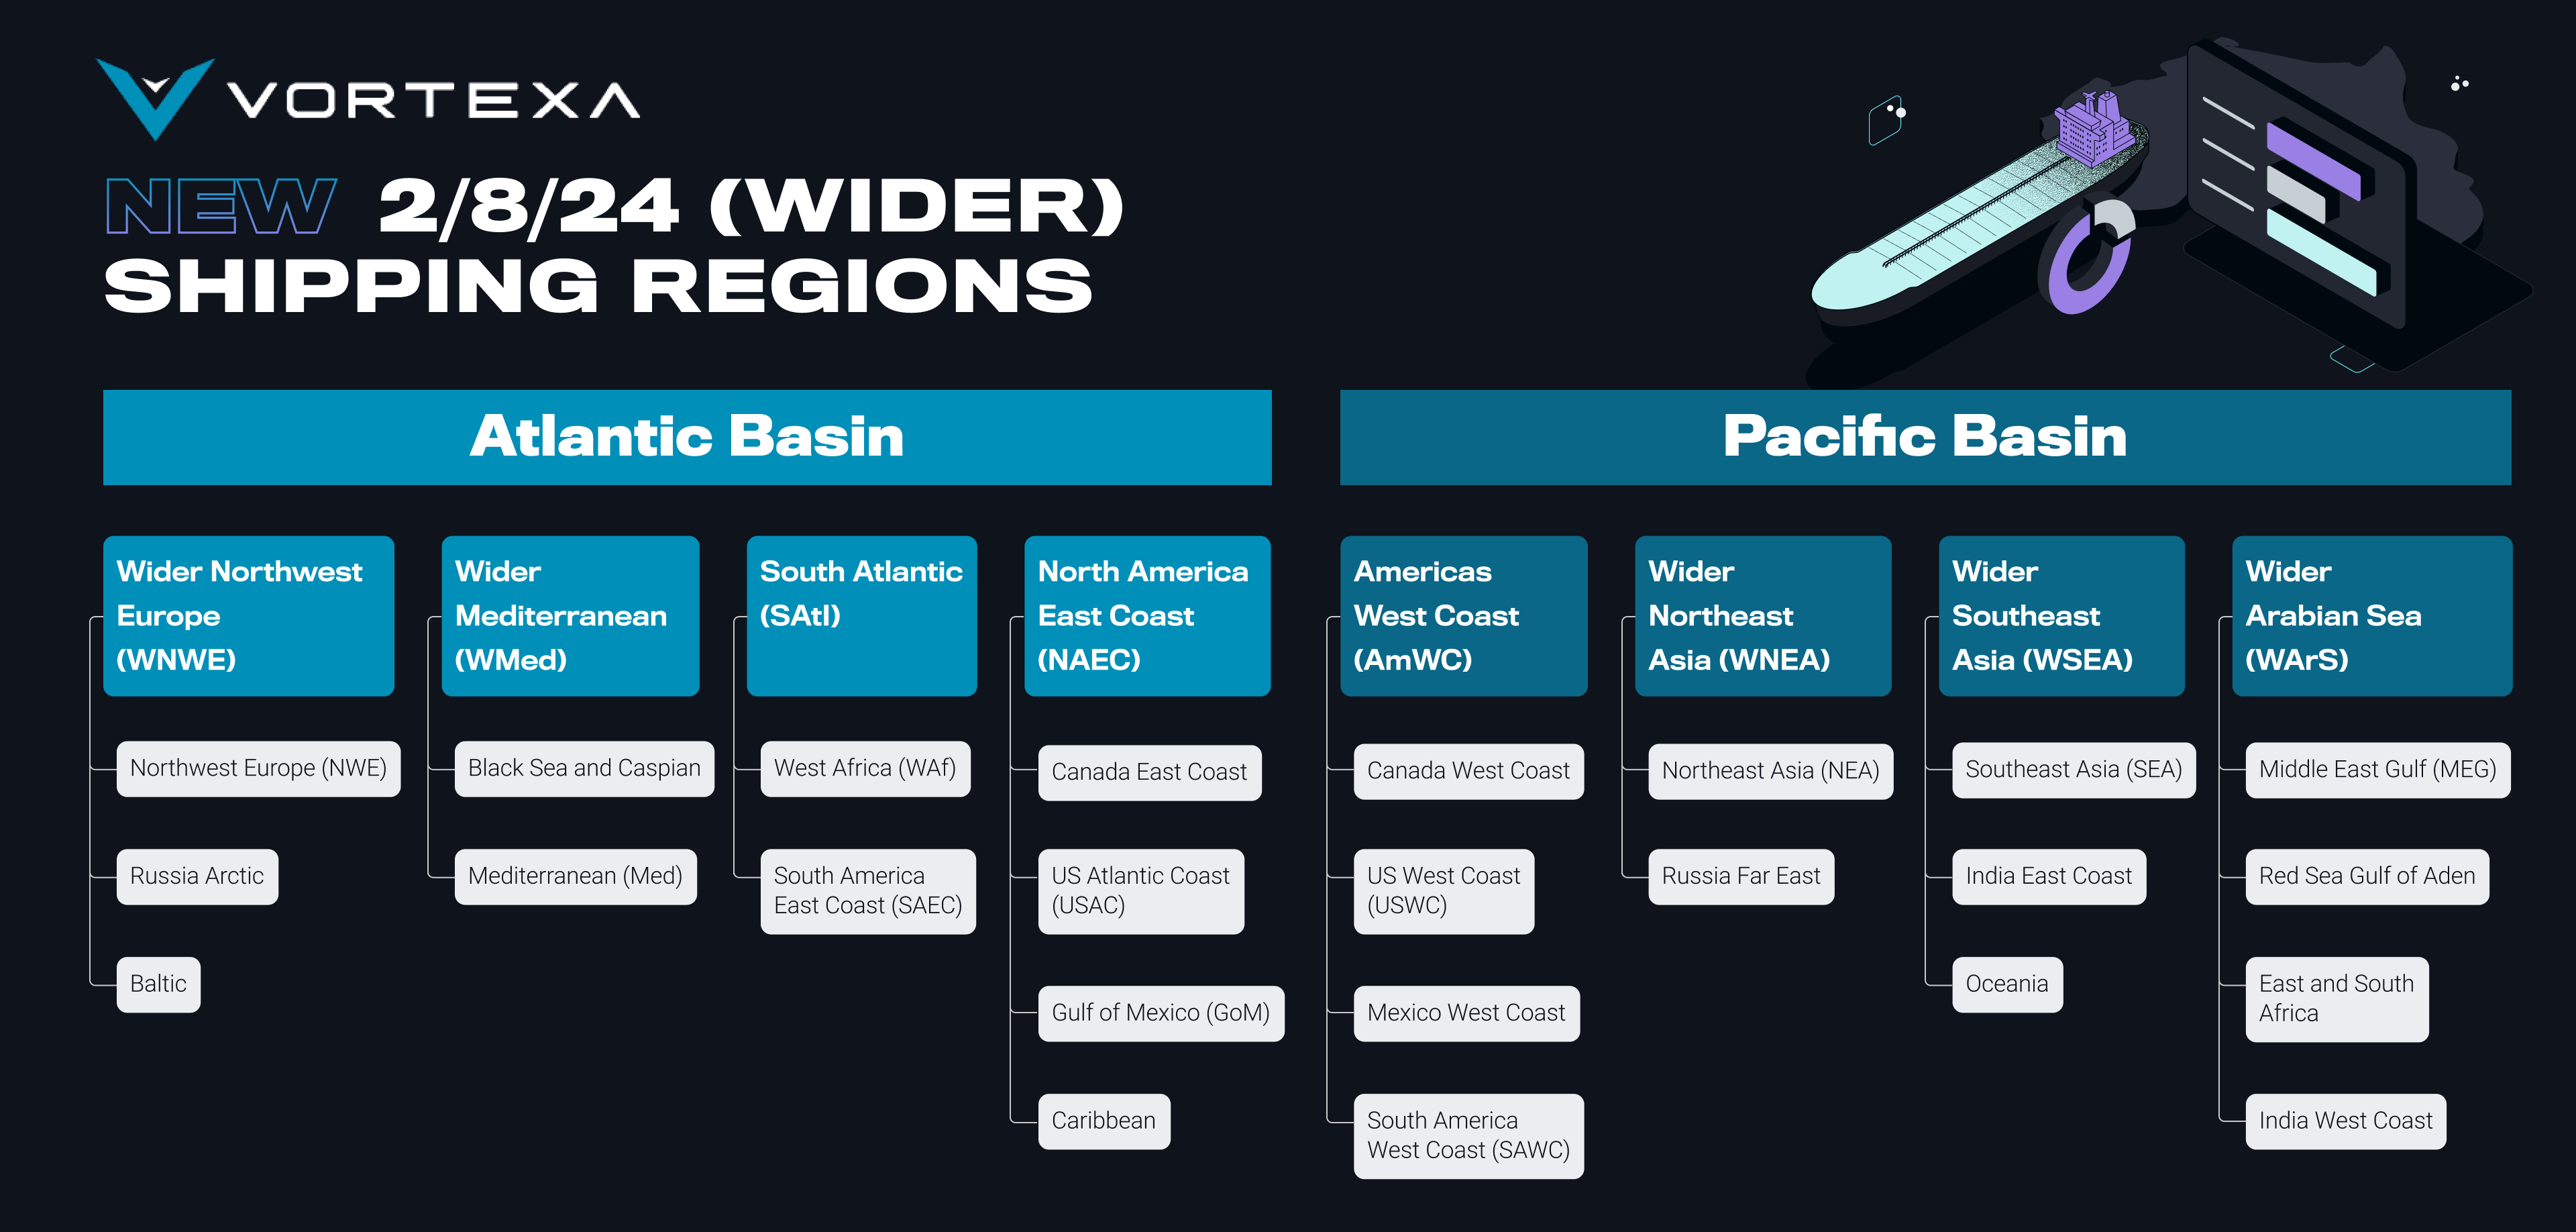
I’m proud to have been part of intense work in the background, resulting in the release of our new 2/8/24 shipping regions. The Vortexa world is now split into 2 basins (Atlantic and Pacific), 8 wider shipping regions, and 24 shipping regions (see chart below). This followed widespread internal and external consultations to make sure we establish an as compact as possible but also meaningful regional system that meets the different demands of the industry (trading, shipping, analysis, …) in the best feasible way.
You may argue on a first instinct that it does not matter how you cut the world, as after all the individual data points will anyway make up the global total. But the art of good analysis is to simplify things (data) in a way that relevant, clear and easy to grasp storylines are emerging. So it is about simplification, completeness, and relevant regional aggregates.
Simplification: essential trends exist only in aggregation
There are many layers to dissect Vortexa data: active flows for more than 200 countries or territories, 2000+ ports or 5000+ terminals, onshore inventory data for 500+ storage locations and voyage data for 12k+ tankers and gas carriers. There are many use cases, e.g. in logistical planning and competitor analysis, where this level of detail is required. But if you want to distil market-changing trends you will need to aggregate and simplify. If you try to find them by looking at hundreds or thousands (or tens of thousands if you start to look at a product by product basis) of time series you will fail.
To illustrate: if the Netherlands were to change their legislation, leading to lower gasoline exports to developing countries, it only matters from a big picture perspective if it is not counterbalanced by higher exports from neighbouring countries like Belgium. Otherwise, it is only material for directly involved players.
We think we have struck the right balance with our 24 shipping regions, with each region being big enough but also somehow defined as separate regional market.
What is the relevant regional scheme?
Everybody looking at supply/demand/flow analysis will have come across the same problem: how to group the world into meaningful areas?
Standard approaches are defined by country boundaries and the related availability of national statistics. It is easy to follow that scheme, but it is questionable whether it is reasonable to treat energy behemoths like Russia, China or the United States in the same way as Guatemala, Malta or New Zealand.
Another traditional but in essence highly arbitrary approach in our industry is to split between OECD and non-OECD countries. Supposedly the former are developed and the latter developing, but surely the best performers in the latter group are far ahead of the laggards in the former group in many statistical criteria. The OECD group is scattered all over the planet (with notable exceptions in Africa and the Middle East) and also steadily expanding, requiring regular painful adjustments in many analyst’s energy models. Did you know that Israel, Chile, Lithuania, Colombia and Costa Rica are all part of OECD?
What I learned over recent years at Vortexa is that seaborne crude and products are very much at the heart of physical and financial energy markets, albeit accounting only roughly for half of the respective globally used volumes. Accordingly, in order to understand the path of crude and product prices, global markets need to be sliced into meaningful segments.
Prices lay the bridge to trading, and the availability of regional benchmark prices or freight rates is a strong indicator how markets are split in practice. The US Gulf Coast, Northwest Europe, the Med, the Middle East Gulf and Singapore/South East Asia are amongst the core hubs of the oil and gas market, with Northeast Asia, Oceania, East Africa, West Africa, Brazil, and the US East and West Coasts following suit and helping to define further suitable shipping regions.
Altogether it is a mix of distance, geographical barriers (canals, capes/coast lines, oceans) and legislative barriers that define our shipping regions. National boundaries play only a limited role. For instance, it makes perfect sense to split France and Spain into Northwest European and Mediterranean parts. For US Gulf Coast refiners, Caribbean and South American East Coast markets are much “closer” than their own US East and West Coasts due to a combination of the Jones Act and the Panama Canal, the latter especially in times of droughts. And putting Russia’s Baltic, Black Sea and Far East areas into the same brackets is about as plausible as putting Australia, Alaska and Chile together.
Another way to define reasonable regions is to look at how many ballasting vessels are available within a few days and would be easily willing to engage in a given market. Of course the cut to 24 regions does not hinder our clients from going deeper, e.g. separating East and West Mediterranean or Australian markets, which are provided under the label of Alternative Regions.
Completeness: How amazing is it to have up-to-date daily data on a global basis in easily digestible buckets?
How often in my good old days did I try to spot and fill the frequent holes in JODI data, providing national statistics for demand, supply, trade and inventories of different levels of completeness and quality. As of 19 Feb, the latest available data was for December 2023, with data available for 50 out of 117 listed countries. For December 2022, some data for 71 countries was available. Trying to extract global trends from this data is pretty challenging, apart from the fact that it will be quite outdated.
With Vortexa you have essentially complete coverage of all ports in all countries, updated on a constant basis, with robust historical assessments usually available for up to very few days back, while especially on an arrivals basis there are valid indications as well various weeks into the future. It still amazes me that all this data is built bottom up on a cargo-by-cargo, vessel-by-vessel, terminal-by-terminal, and day-by-day basis, allowing essentially any type of aggregation.
Get live data on platform (crude, products, LPG & LNG, motor fuels)
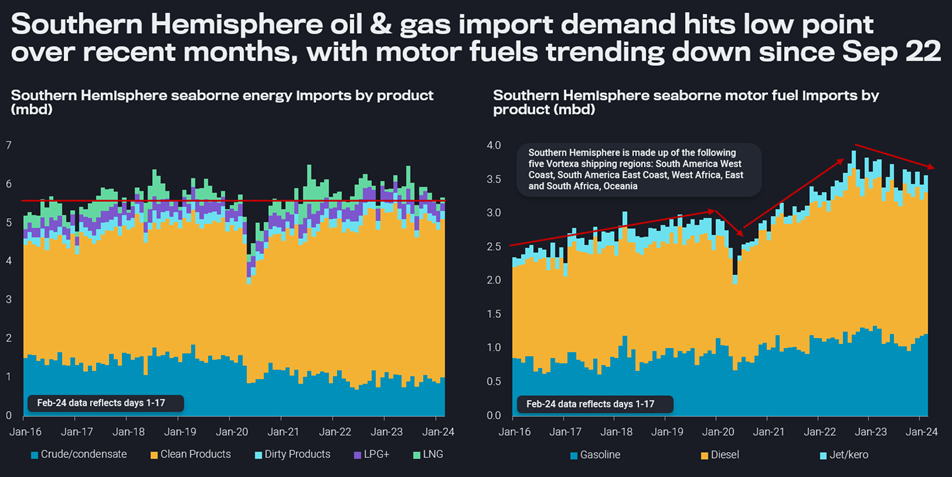
The new shipping regions are now facilitating to look at all flows, vessel, and inventory data in a meaningful, mutually exclusive and collectively exhaustive aggregated manner. A relatively simple sentence, but of immense meaning… For instance, with a couple of clicks you can compile energy and motor fuel imports into markets of the Southern Hemisphere, which are close to impossible to track with national statistics. The respective charts unveil instantly that (import) demand in these primarily refined fuels markets is far less dynamic than most people would expect.
Vast amount of use cases to empower our clients to take their own conclusions
The new shipping regions enable quick but comprehensive analysis in widespread market contexts. Import, export and onshore crude inventory data allows essentially live assessments of supply/demand patterns in regional markets.
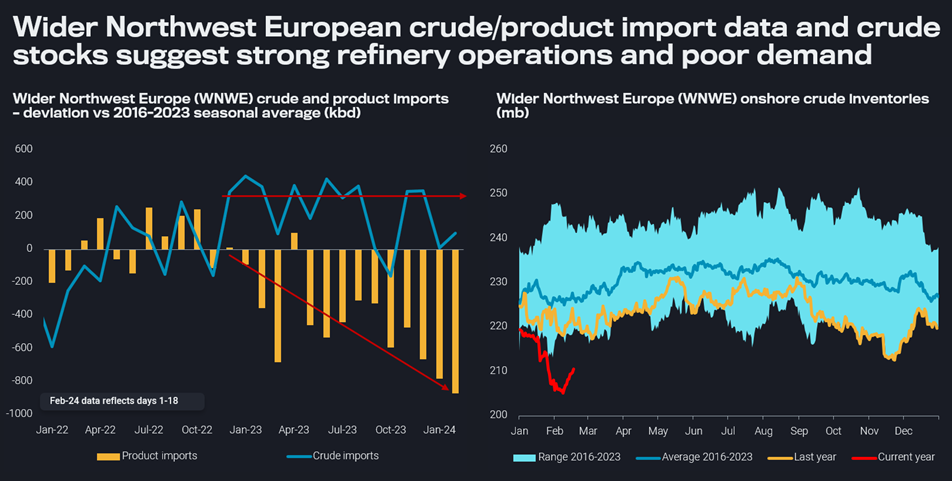
The chart below for Wider Northwest Europe shows nicely how movements in crude imports and onshore stocks have been aligned over the last couple of months. Unless crude imports were not close to the upper end of the seasonal range, stocks were drawing, implying also strong refinery runs. The same is underpinned by the deep fall of refined product imports, which however suggests that weak demand must play a role on top of healthy regional refinery runs. Being able to draw inventory and flow datasets together from the same source with the same geography frame facilitates the work of analysts substantially.
Get live data on platform (crude imports, product imports, crude onshore stocks)
Regionally aggregate flows are also a crucial input into any arbitrage investigation. Adding the vessel perspective allows for deep dives in tanker supply/demand and freight pricing (vessel availability, fleet distribution, …). For instance, with a few clicks you can see that Suezmax tankers are going increasingly to the South Atlantic market and less so in the US Gulf after discharging their crude cargo in Northwest Europe. Internally, we will use the new shipping regions in combination with additional waypoints to enhance our destination, diversion and other models, as well as to beef up some data quality procedures.
In general, at Vortexa we aim to empower our customers to do their own analysis in their specific market context, rather than telling them where the market is supposed to move. With client reports and market briefings we try to inspire our audience and give them inroads to different analysis and data use approaches. At any rate, markets are moving fast and with fresh data available every day, commercial decisions should not be taken on outdated external advice. Our newly set-up solutions architect team located in Singapore, London and New York will help with setting up the right data-integration tools, making the best use – amid others – of our new shipping regions.


