The freight market
The freight market is both a turbulent and opaque one, with a distinct lack of knowledge sharing between participants and ever changing geopolitical situations to navigate. Based on the job title you hold or the company you work for, be that a charterer, vessel owner, trader, broker, analyst or otherwise, there’s market clarity that would give you that much desired edge. The essential market wide view, built from the activity of all vessels involved, is a tough one to come by. Without it, market sentiment, historical trends, market opportunities and competitor activity are a challenge to identify. Voyage Dynamics is our answer.
Making sense of the complex and adapting freight market
Vortexa’s Voyage Dynamics helps our users make sense of the complex and adapting freight market, with extensive aggregations, datapoints and charts. Building from a dataset consisting of individual vessel activity, Vortexa distils the deepest level of detail into easily digestible, market wide insights to clearly highlight trends and facilitate competitor analysis.
Voyage Dynamics starts at the granular level for each vessel, which when aggregated provides the market wide, macroeconomic view. This view is crucial to solving the market uncertainties mentioned previously, and contains all activity for the oil and gas vessels we track. We break that activity down into timestamped origin, destination, waypoint and canal transit, congestion, floating storage and STS events. With additional considerations for cargo grade, cargo quantity, effective controller, charterer, speed, distance and many more.
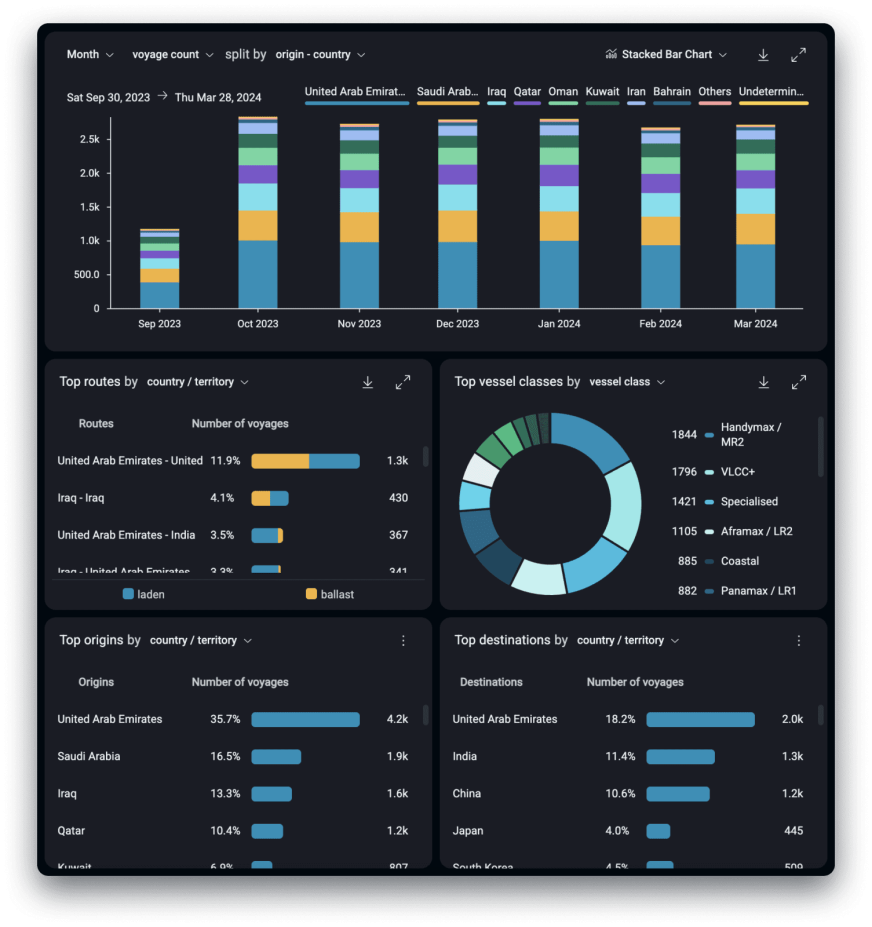
Vortexa condenses this information into a clear view of historical vessel activity on a timeseries chart by voyage count, tonne miles and voyage distance, which are all queryable on a fleet, location or corporate entity basis. Additionally, we’ve aggregated this data into top routes, origins and destinations for an instant view into current industry activity.
Discover market fluctuations caused by geopolitical shifts
Within a few clicks, Voyage Dynamics shows you market fluctuations caused by geopolitical shifts, including the Houthi attacks in the Red Sea.
To take one of our newest datapoints as an example, Voyages from the Middle East Gulf (MEG) to Europe are continuing to experience sharp increases in average voyage distance since 1 Feb 2024. This leads to dramatic price increases for both voyages as well as the cargoes onboard, as well as increased emissions output as vessels avoid the Red Sea and instead transit via the Cape of Good Hope.
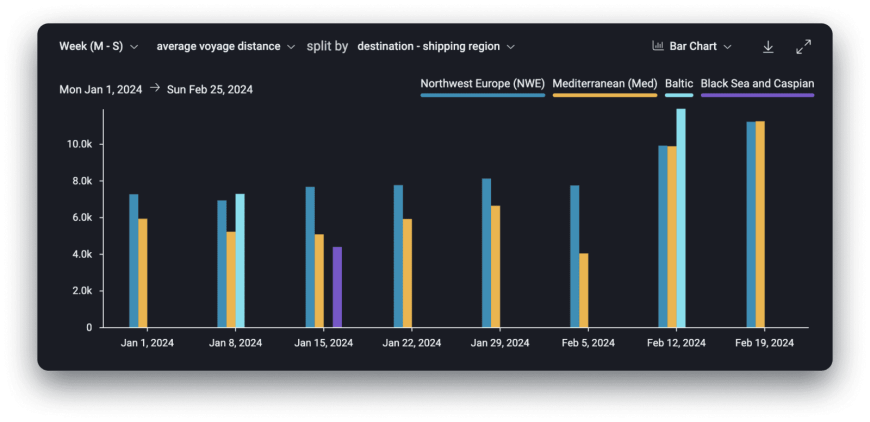
See it live on the Vortexa platform: Average voyage distance from MEG to Europe
See it in action
Our Voyages data is extremely detailed, but with a well explained API and an intuitive UI in Voyage Dynamics, we’re striving to provide as much detail as you need to solve complex issues, in the most easily digestible way.
See it in action for yourself. Request a trial for Voyage Dynamics and get further information on our Freight offering on https://www.vortexa.com/product-freight-analytics/.


