Click to zoom
Key Takeaways:
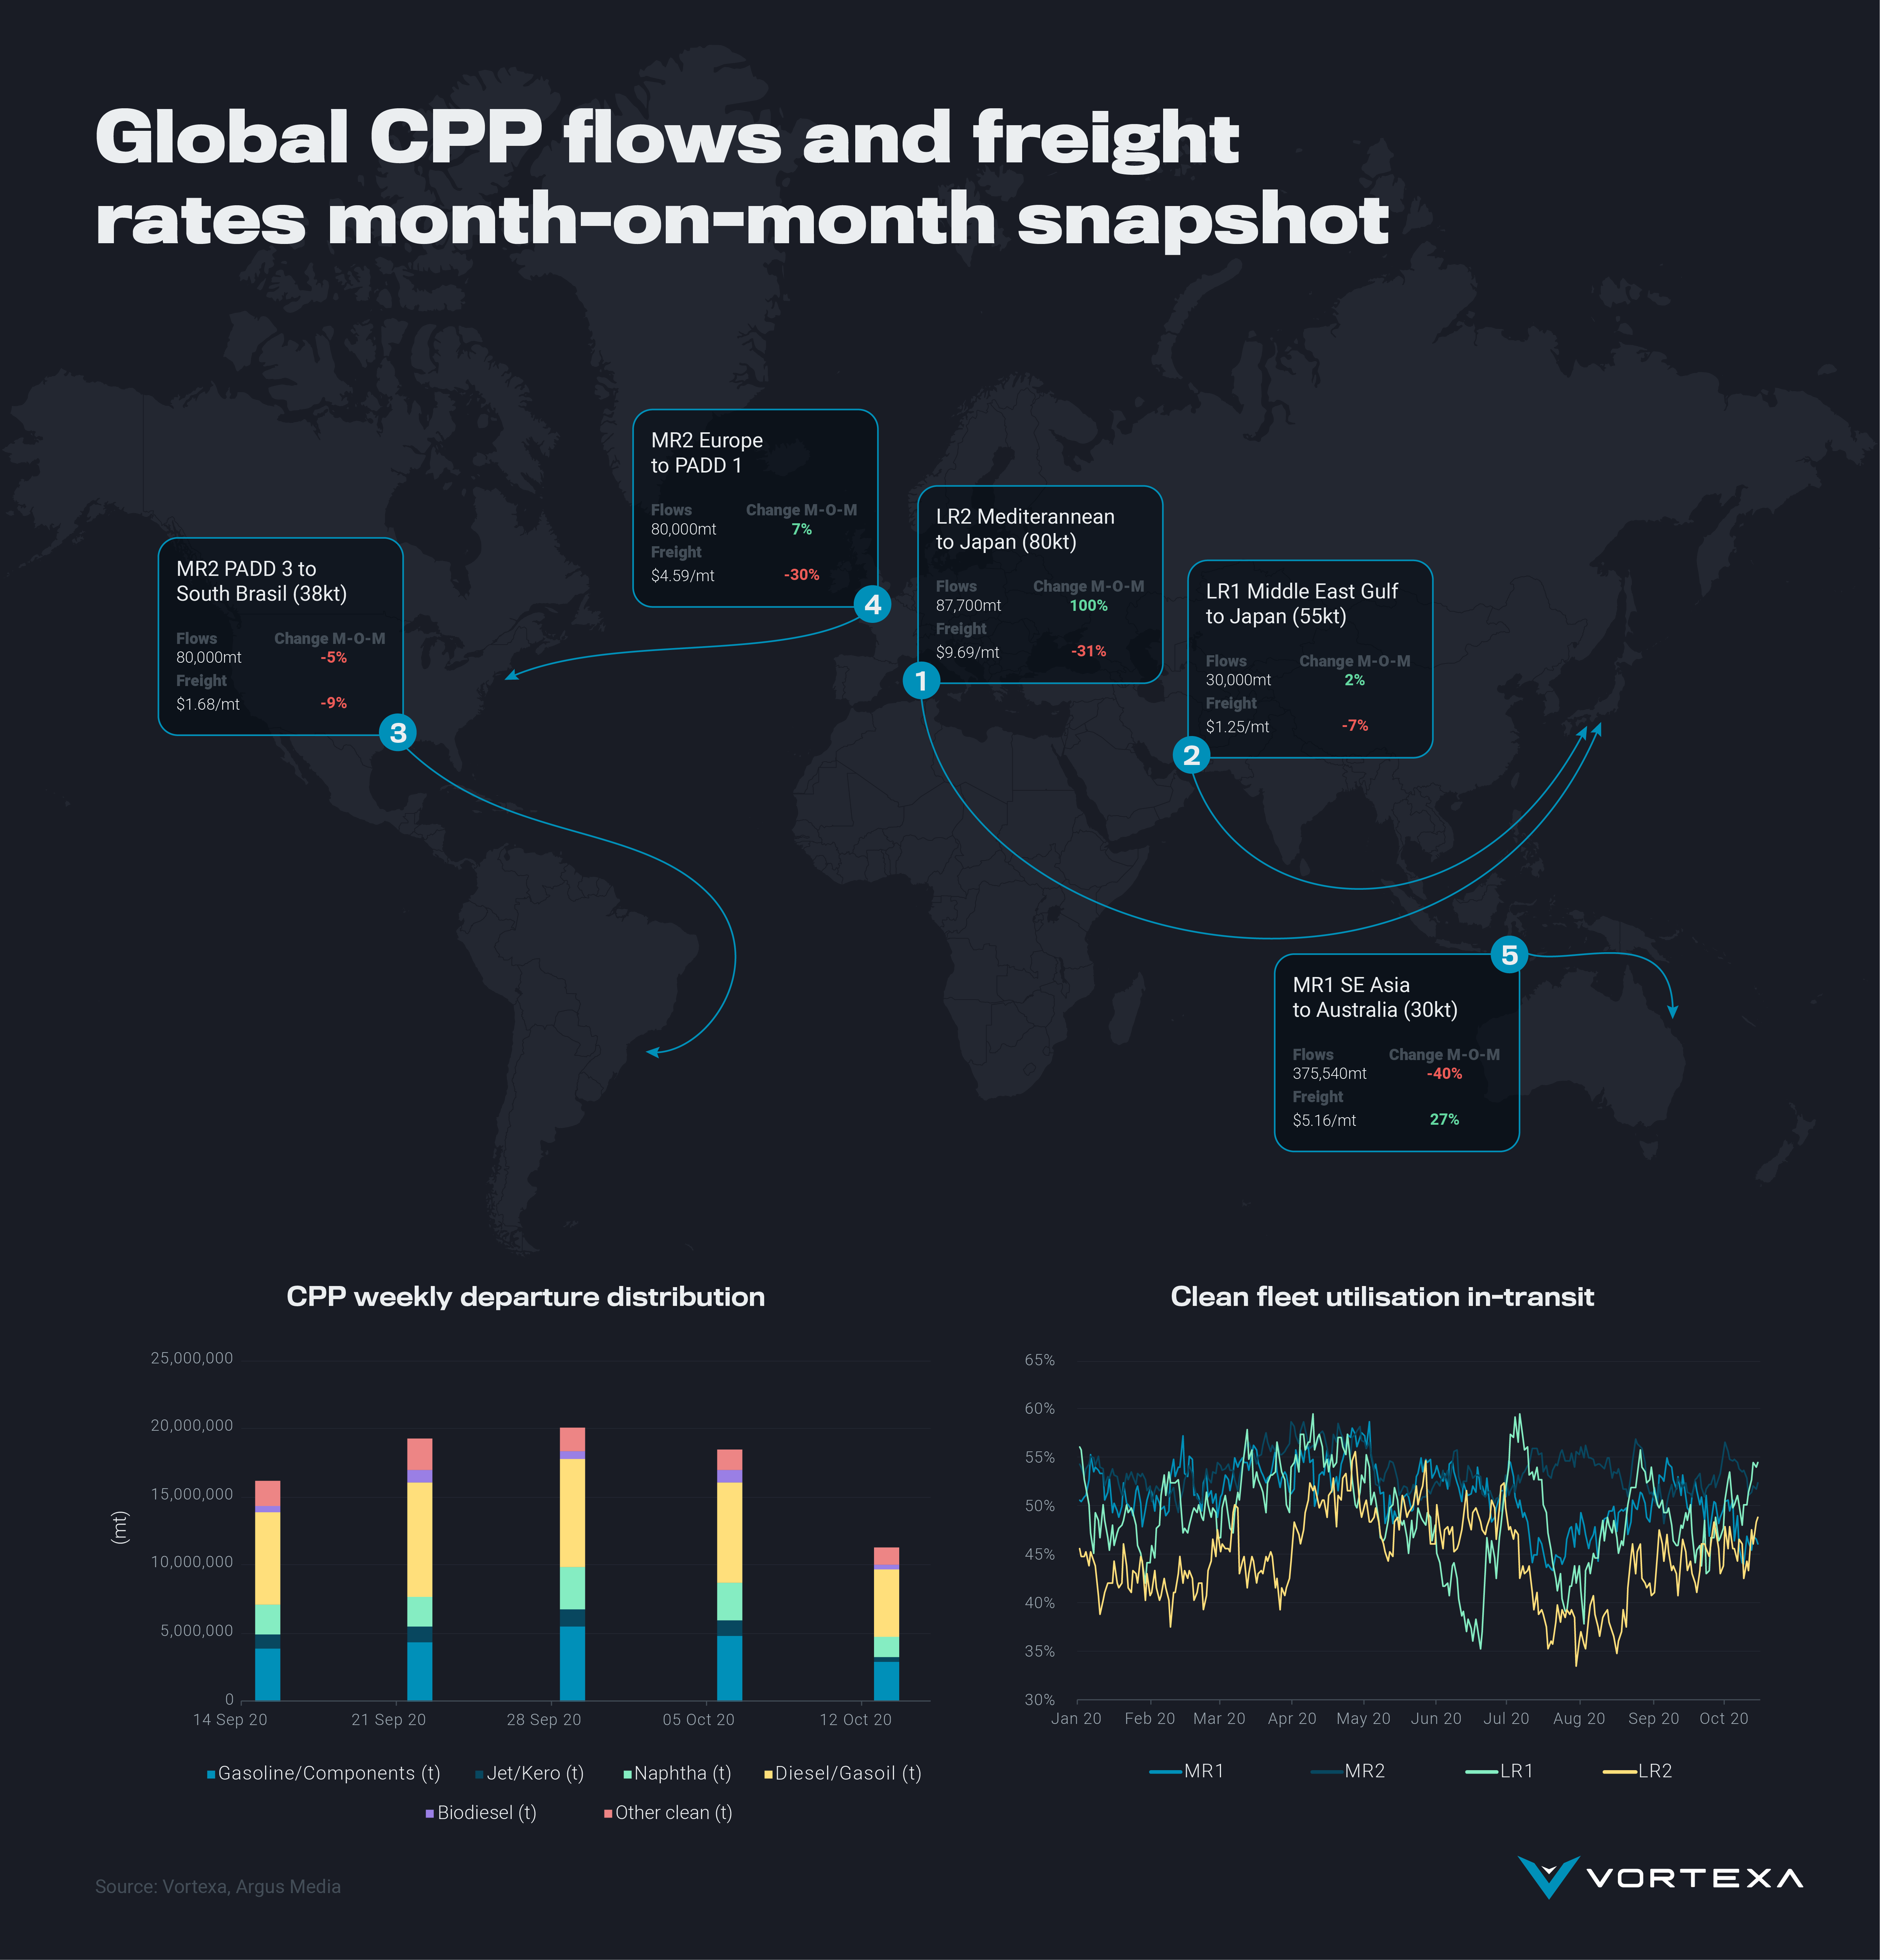
- The global build of unemployed tonnage is the cause of recent weakness and a bleak outlook in clean tanker freight markets, as evidenced by a month-on-month drop in freight rates across 4 out of 5 routes analysed.
- As MR1 tonnage left SE Asia to chase better opportunities elsewhere, the idiom that shipping is all about timing rings true. The resulting lack of tonnage in the region drove a 27% increase in the cost of freight per ton even as cargo flows towards Australia softened.
- The surge in volumes in the LR2 Mediterranean to Japan route was only strong relative to a previous month with zero loadings as the arbitrage was shut due to higher freight rates. Since then, with LR2 tanker utilisation still recovering from yearly-lows in August 2020, cargo volumes from the Mediterranean were unable to prevent rates from falling 31% month-on-month.
- With CPP flows towards Latin America down 9%, MR2 tankers sought employment trans-Atlantic – pushing rates down 30% even as flows to PADD 1, rose 7% month-on-month driven partly by increased demand for winter spec gasoline.
- Looking ahead, with utilisation back to pre-pandemic levels, there may be some support to freight rates as long as cargo volumes don’t fall further.


