Global crude imports – what do they tell us about the state of the market?
Vortexa outlines how global crude imports show a slow recovery for refiners.
Making use of Vortexa’s complete coverage of global crude and condensate flows, we observe the lack of clear-cut signs for a global recovery in seaborne crude flows. For this analysis we took average global crude imports in 2019 as a basis and compared against monthly crude imports relative to this basis up to and including March 2021.
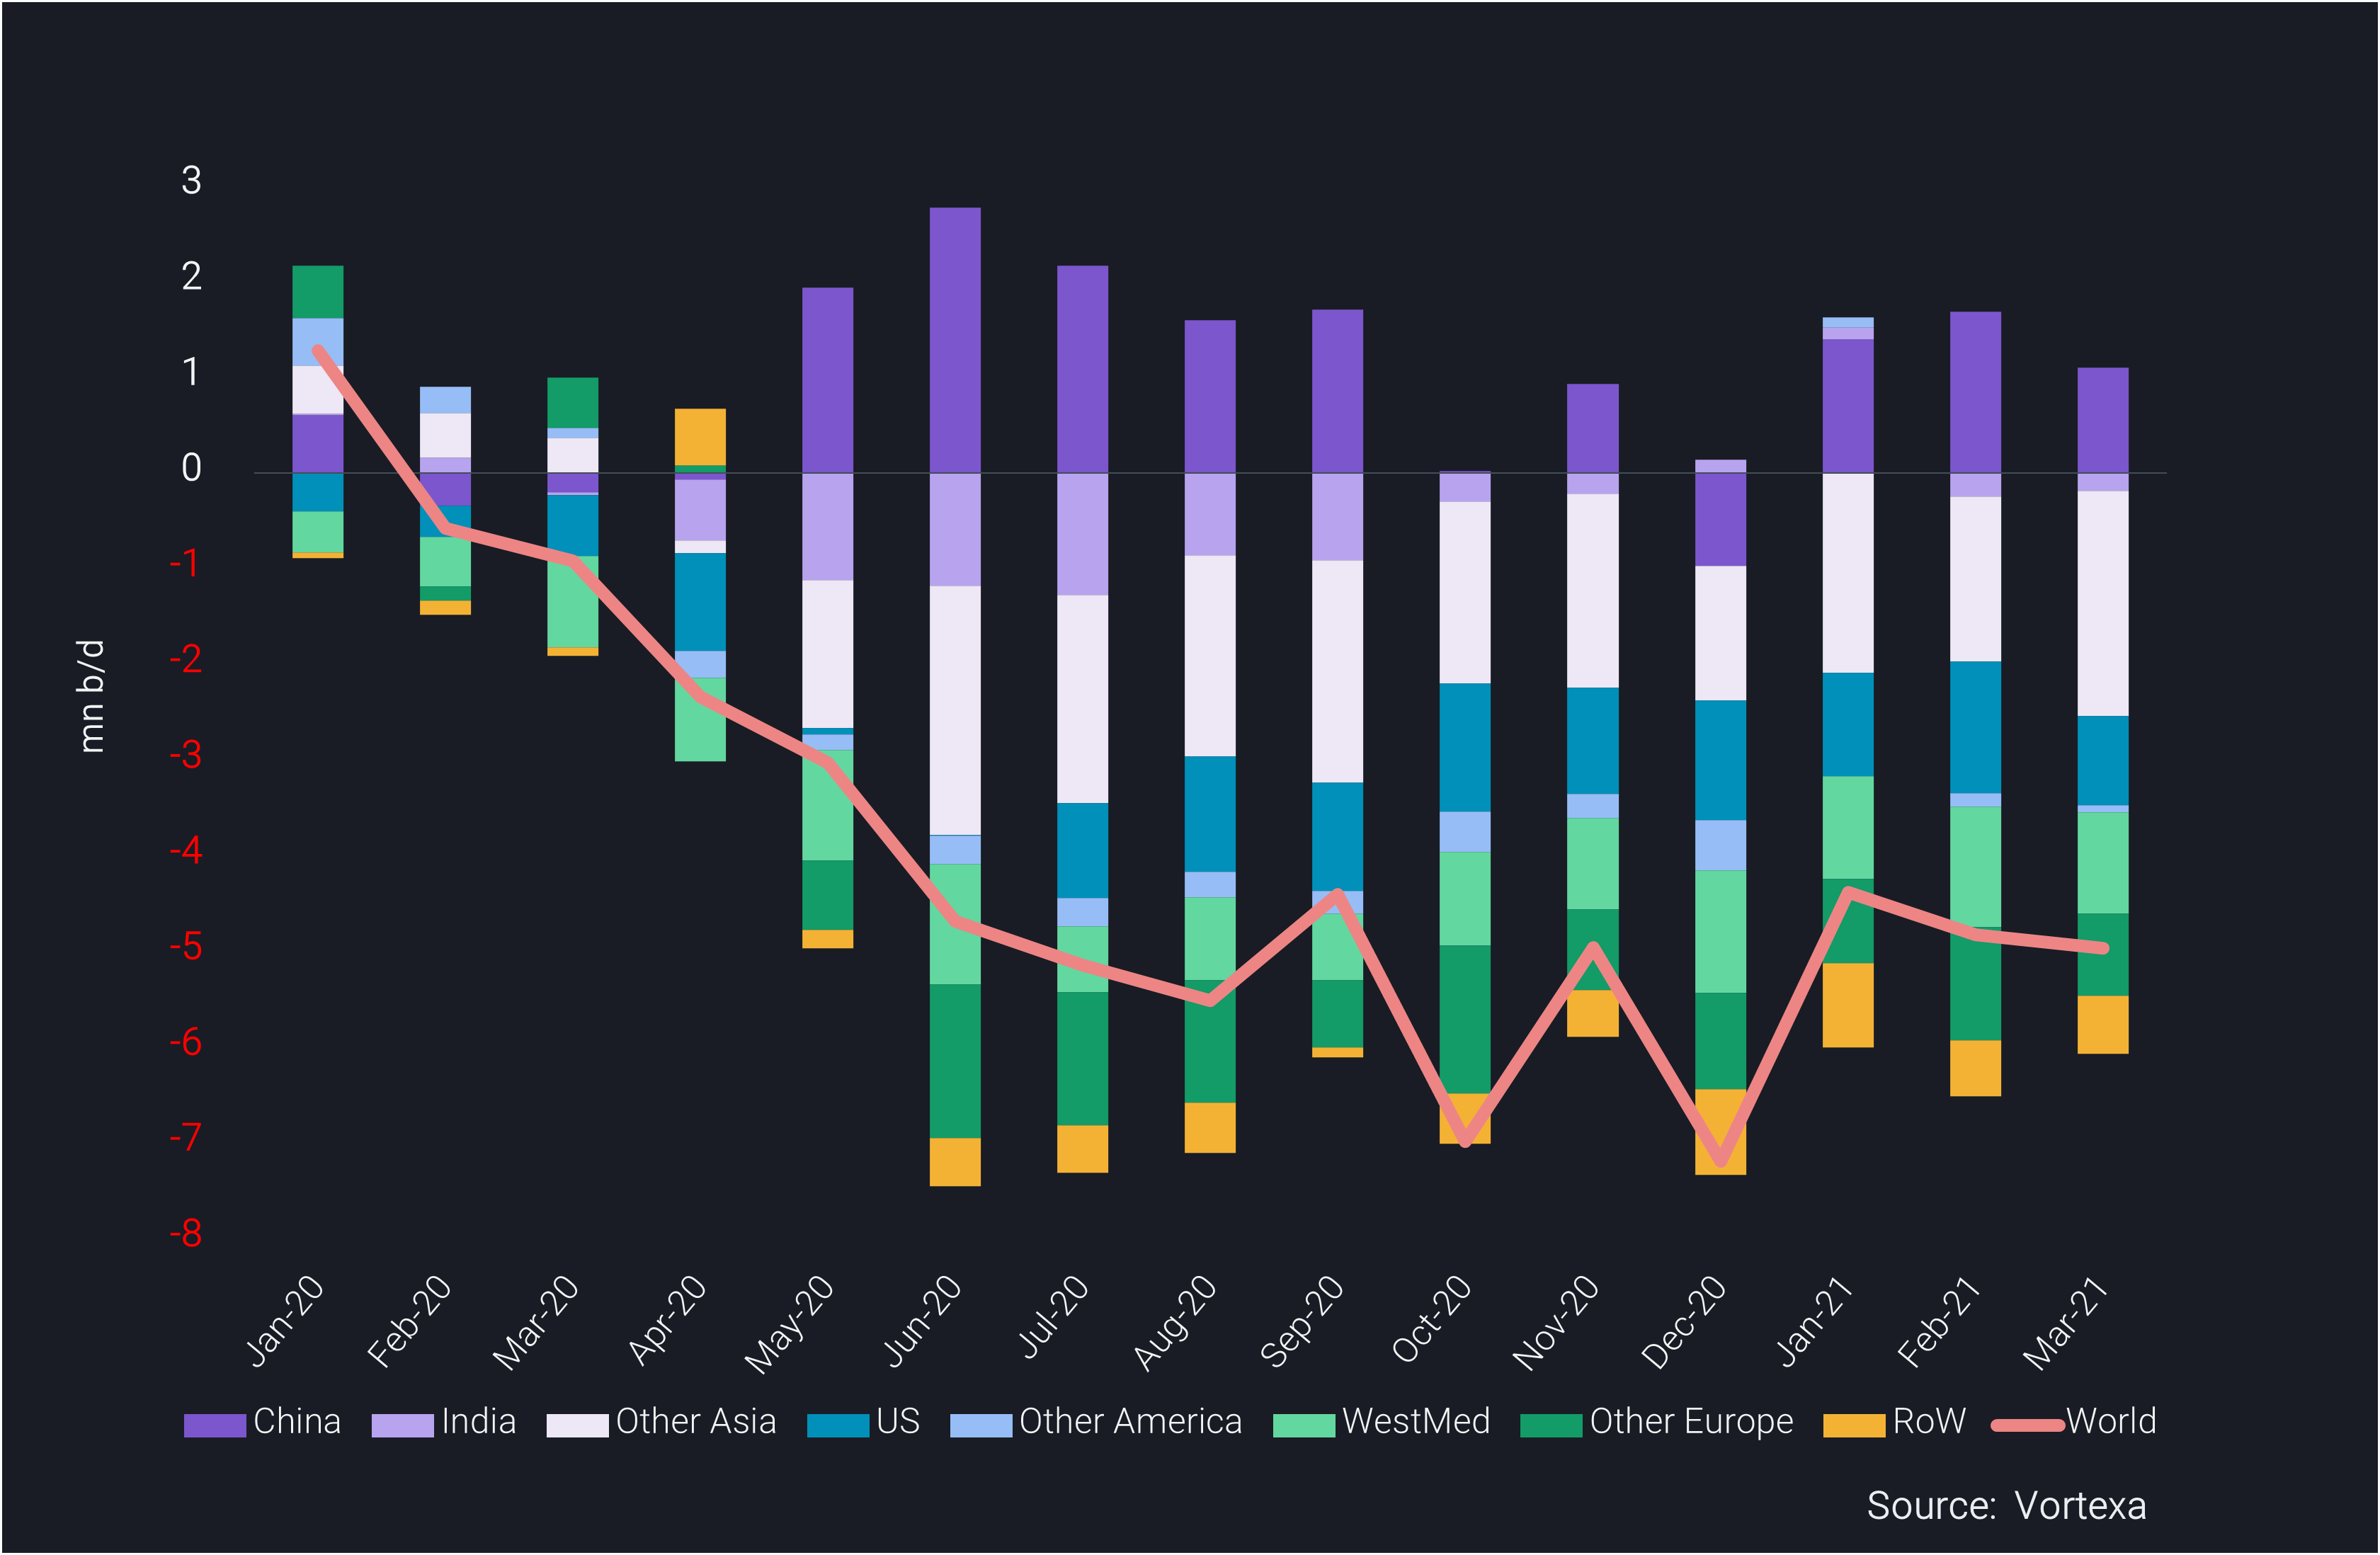
Crude imports by destination region Jan 2020-Mar 2021 vs 2019 average (mn b/d)
Crude import growth stagnation reflects a slow recovery for global refiners
-
Starting at a global level, seaborne crude imports are still only around 90% of the 2019 baseline, with barely any noticeable improvement from summer last year. In volumetric terms, the market is still consuming about 5mn b/d less in seaborne crude imports compared to before the pandemic hit the market.
-
China is the only major importer in the market that has seen regular growth in imports over the last 15 months vs the 2019 average,with stock builds playing a crucial role in addition to actual processing at refineries. India is approximately matching the 2019 baseline for now, but the recent reintroduction of regional lockdowns in the country could threaten import levels going forward.
-
It is worth nothing that some improvement in oil demand is being disguised by persistently low crude import levels, due to the unwinding of onshore storage. Across Q2-Q3 2020 traders pushed surplus barrels into storage rather than refining, as the first global wave of Covid-19 comingled with the hike in exports due to the market share battle between Russia and Saudi Arabia. Long-term inventories are clearly in discharge mode so far this year, as illustrated for instance by the loadings from crude storage at Saldanha Bay, South Africa.
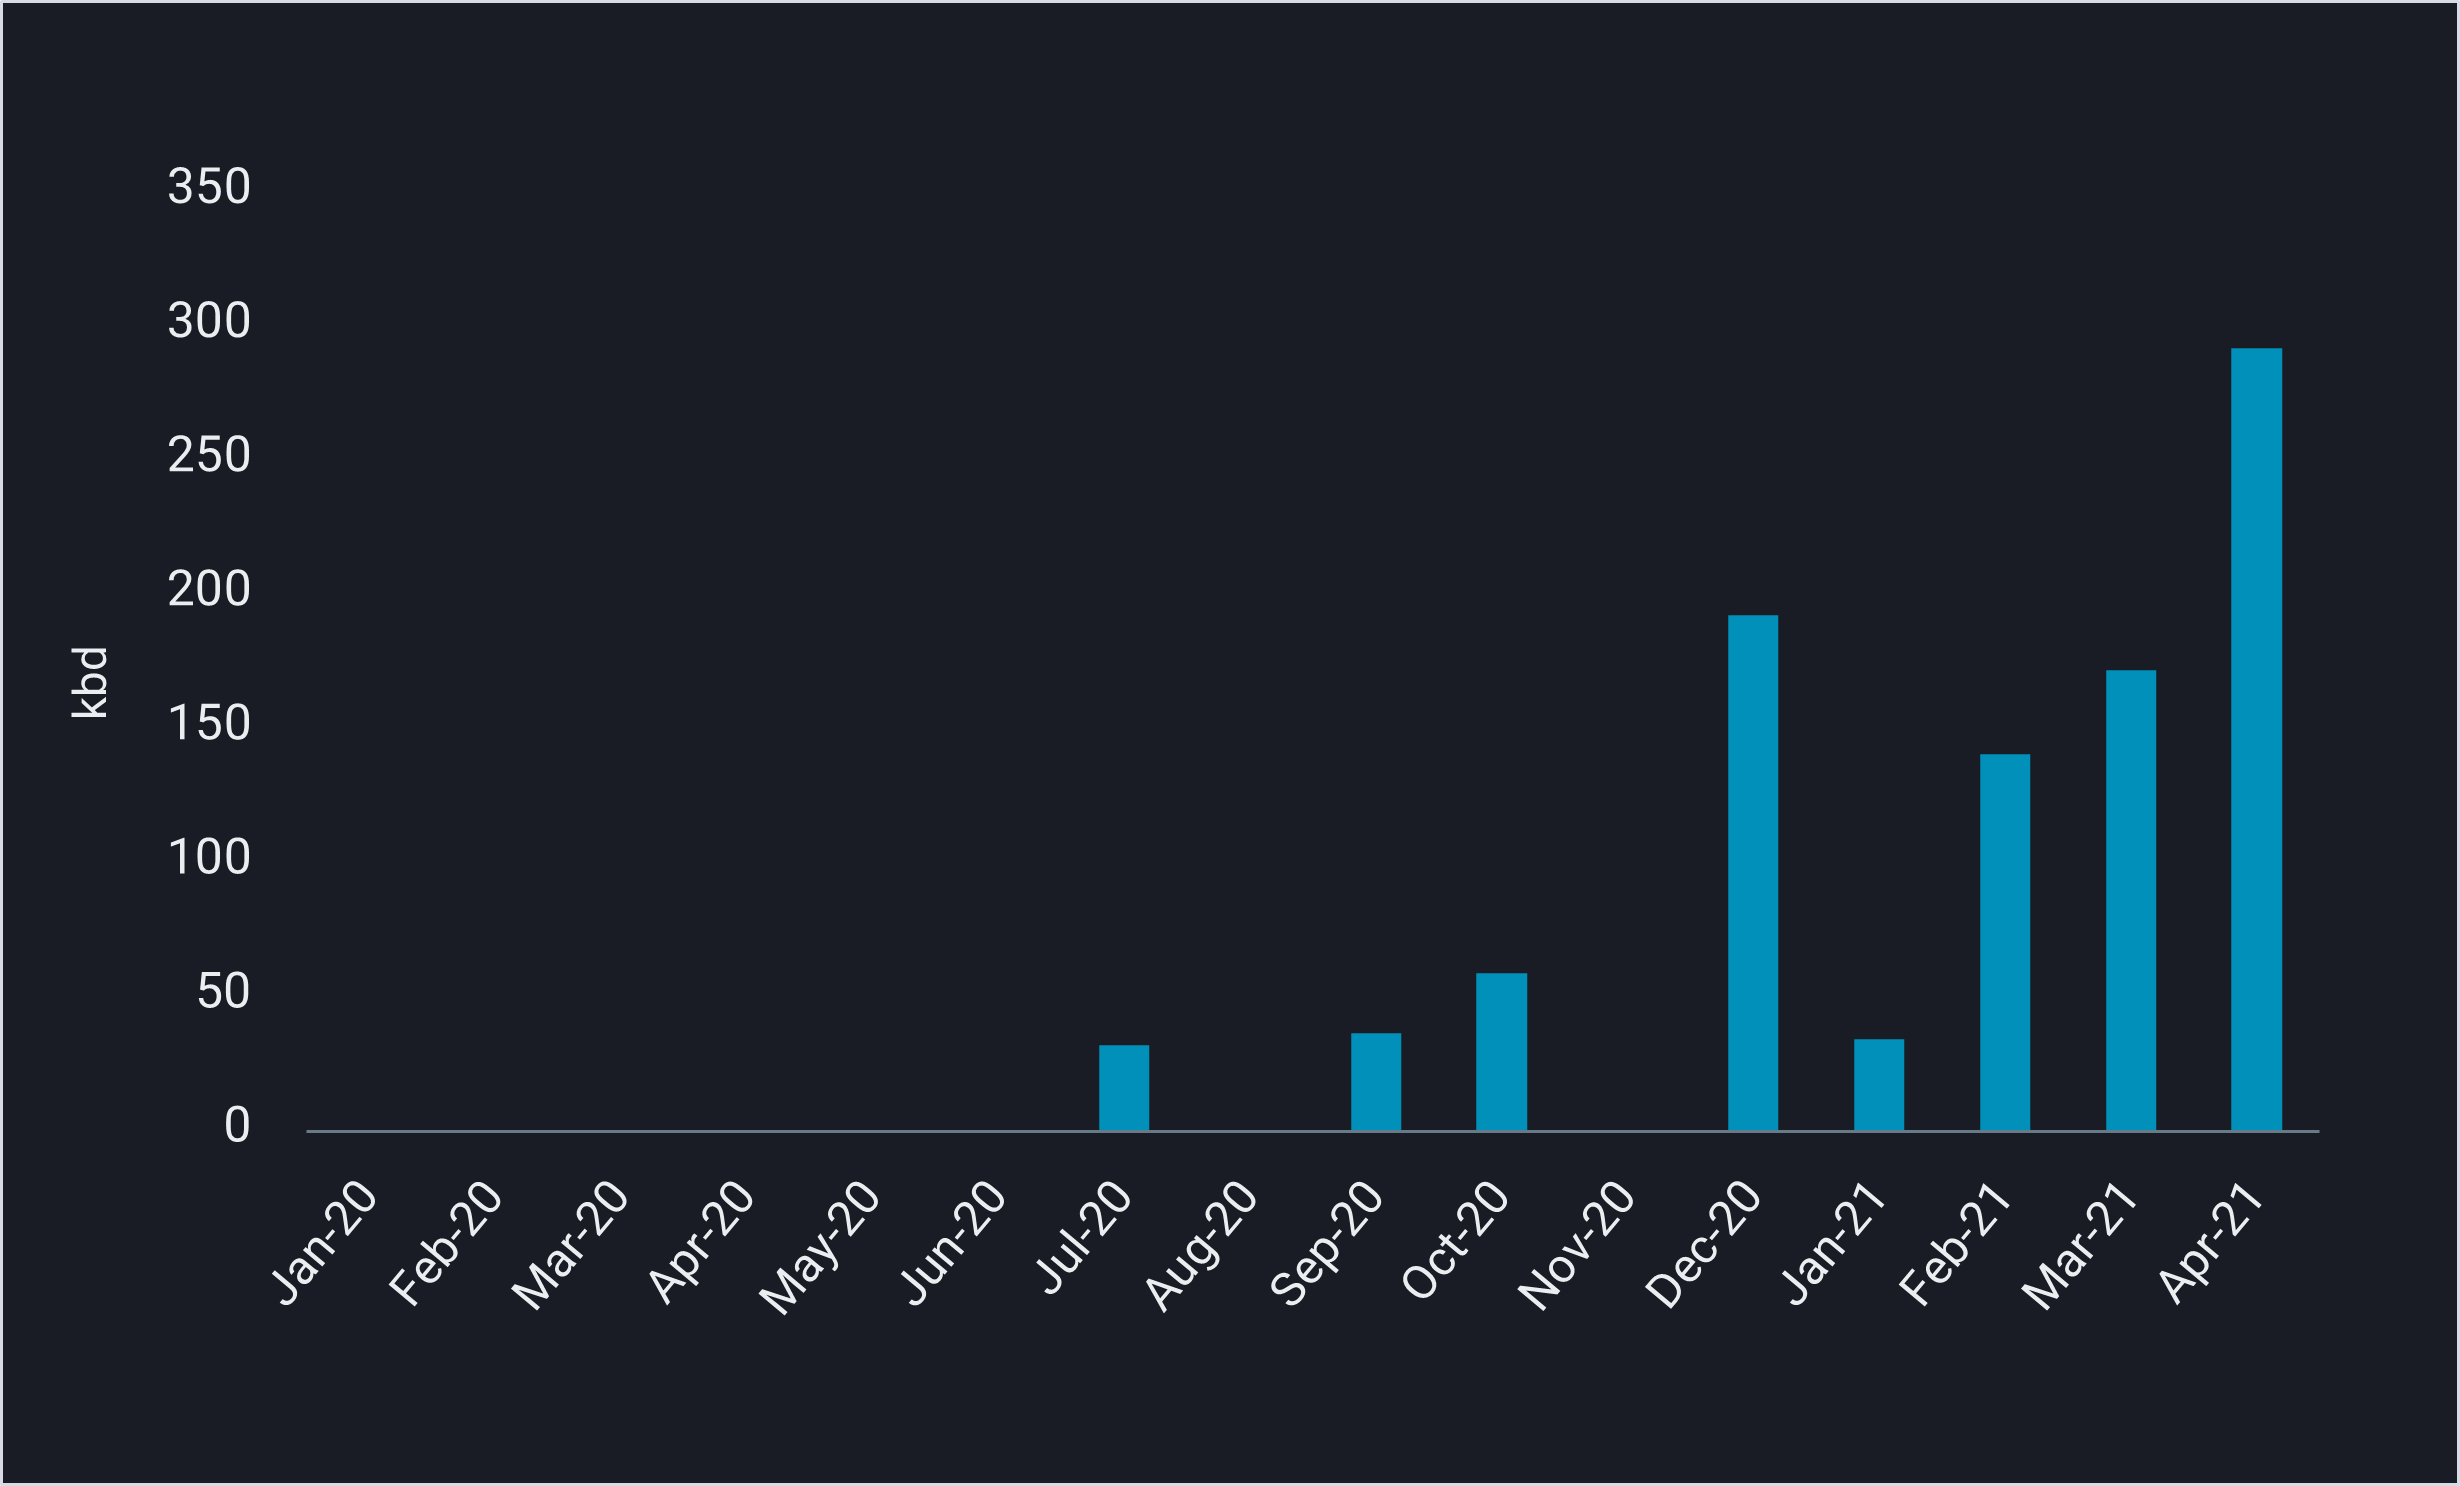
Saldanha Bay crude departures (kbd)
Med and US refiners last to increase refinery runs
Although not a perfect match, crude import levels are a clear indicator of refining operations. The strongest declines in imports have been observed in the US as well as France, Italy and Spain (the dominant players in the “West Med” group on the top chart).
- Over the last six months, the US and West Med lost about 30% and 25% respectively of crude imports relative to the 2019 average, vs the global average of 10%. The drop in other European countries has only been 15%, similar but slightly better than the performance of Asia excluding China and India.
- A region that has surprised somewhat is the Americas excluding the US. Crude imports were zooming in to the 2019 average in Q1 2021, with a minor boost coming from the restart of the Limetree Bay refinery at the US Virgin Islands.
Freight rates could still see support from US and China
- The fact that crude imports are still some 5mn b/d below 2019 levels is also a clear testimony to lacklustre dirty freight markets.
- US imports are on an upwards trajectory, creating – in conjunction with a likely rise in Chinese imports and OPEC+ exports – the basis for rising tonne-mile demand and some support for freight rates.
- However, the third or fourth wave of Covid-19 in so many places around the globe and hiccups in vaccination programs may keep the interest of most other players at bay for some more months.
Want to get the latest updates from Vortexa’s analysts and industry experts directly to your inbox?
{{cta(‘cf096ab3-557b-4d5a-b898-d5fc843fd89b’,’justifycenter’)}}
More from Vortexa Analysis
- 12 April 2021, European gasoline to face headwinds after March peak
- 7 April 2021, Q1 2021: Freight Market Update
- 7 April 2021, US Fuel oil and dirty feedstocks exports slump in Q1 2021
Vortexa In the News – CPP
- Reuters, 16 March 2021 – Asia’s Fuel Exporters Target Sales Bump As Refineries Shut Down Under
- Argus Media, 10 March 2021 – BP to close Australia Kwinana refinery in March
- Reuters, 9 March 2021 – Diesel storage in Scandinavian caverns unwinding


