Infographic: US Crude Oil Exports Breakdown – August 2020
See our infographic detailing the recent crude oil exports from the US. What are the trends in August?
26 August, 2020
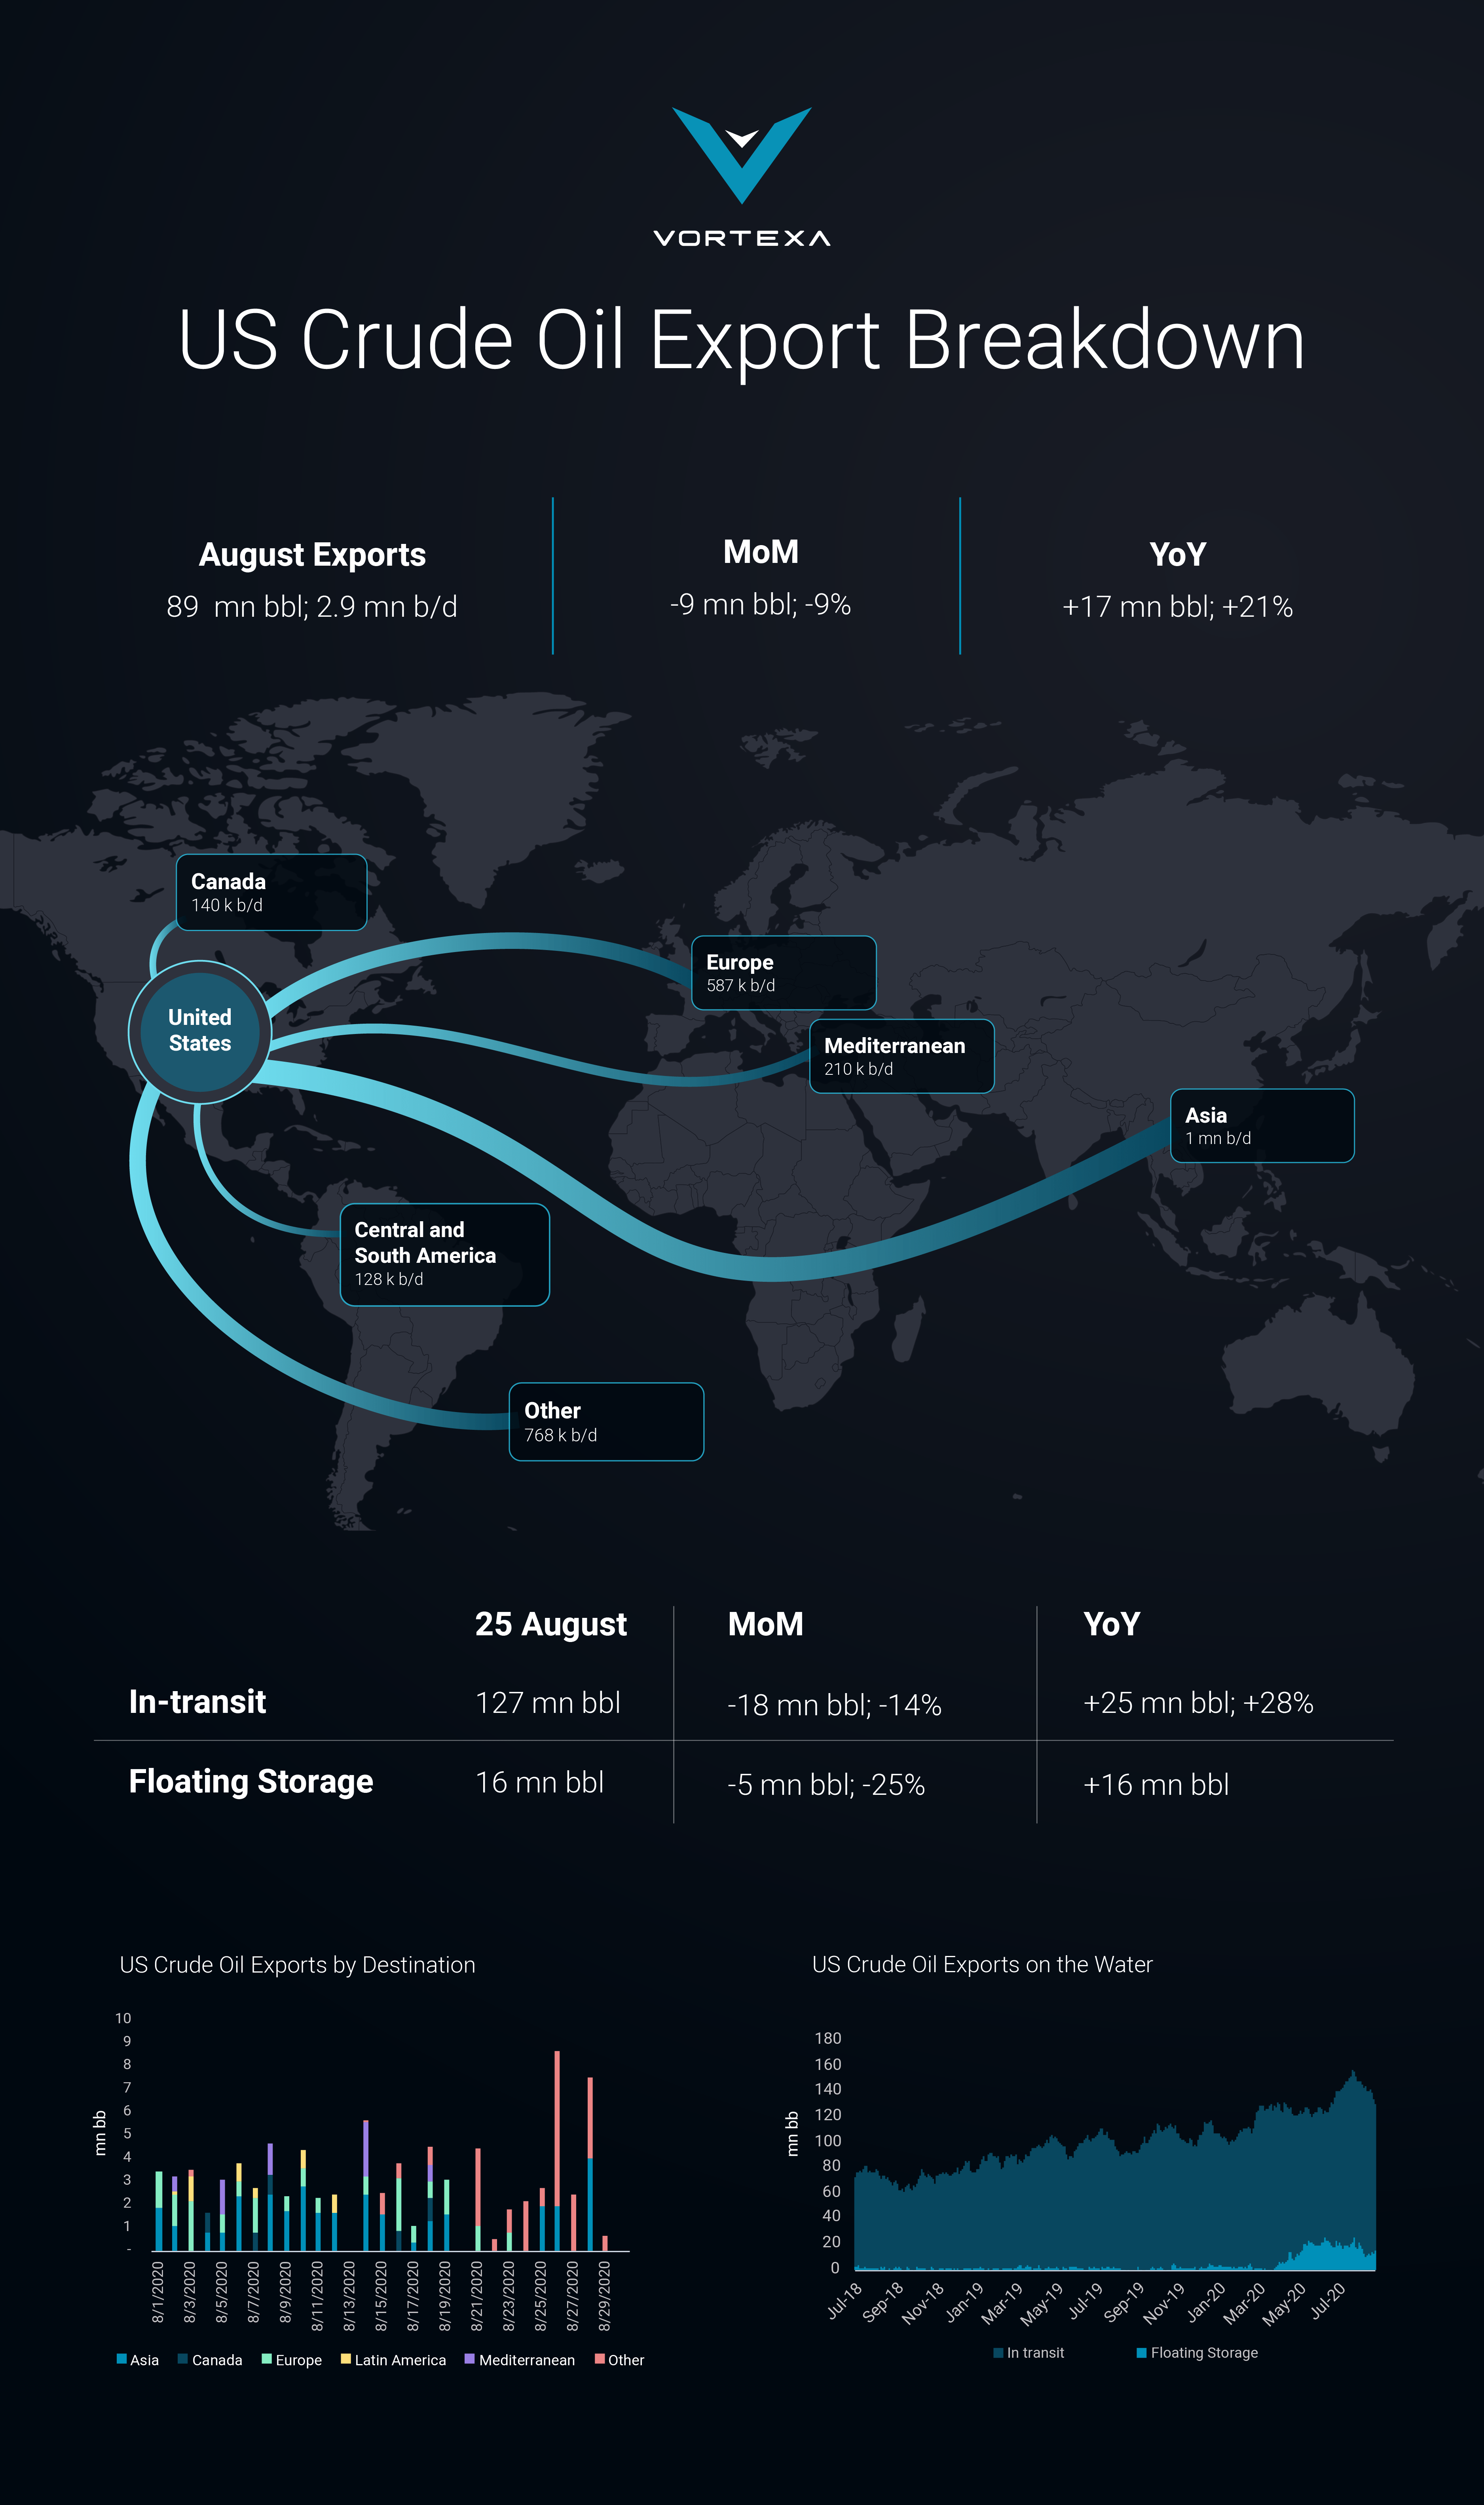
US Crude Oil Exports Breakdown – August 2020
Key Takeaways:
- US crude and condensates exports have slowed slightly so far in August to 2.9mn b/d, down by 9% from the previous month but up 21% year-on-year.
- US crude in floating storage globally remains elevated at 16 mn bbl, as of 25 August. The 5 mn bbl decrease in floating storage between July and August suggests greater volumes of US crude oil are being consumed in international markets.
- Asia and Europe represent the largest share of US exports so far in August.


