Interesting trends in overall stable Atlantic Basin crude supply
Atlantic Basin crude/condensate departures (including intra-country movements) totaled 21.2 mn b/d in April, the highest, albeit marginally, since May 2020
Vortexa data shows Atlantic Basin crude shipments totaled 21.2 mn b/d in April, down nearly 3 mn b/d from Q1 2020.
Atlantic Basin crude/condensate departures (including intra-country movements) totaled 21.2 mn b/d in April, the highest, albeit marginally, since May 2020. However, the year-to-date average of 21 mn b/d is still down a full 3 mn b/d from pre-pandemic volumes of 24 mn b/d in Q1 2020. Various dynamics are driving the shifting supply picture across different regions within the Atlantic Basin, but the overall upside is probably largely limited to Russian supplies.
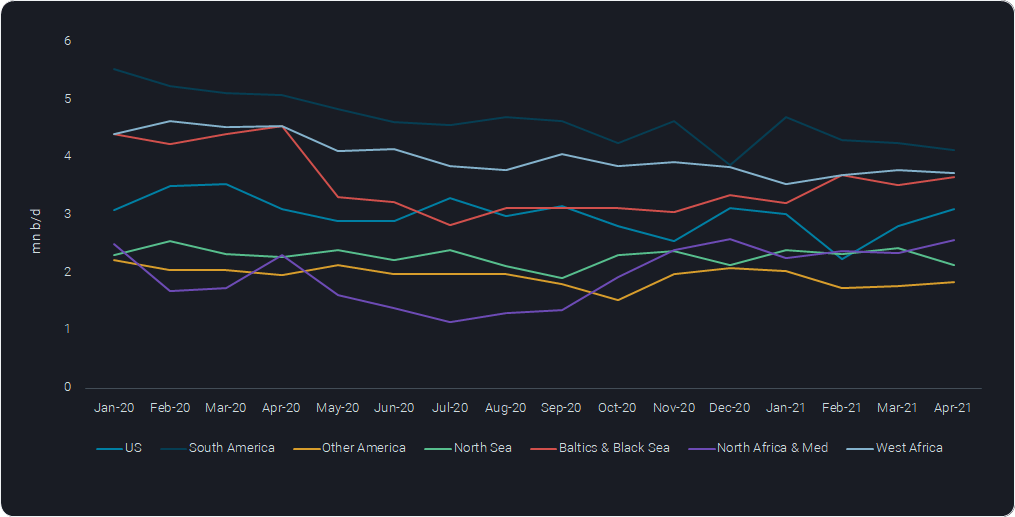
Atlantic Basin Crude Departures by Origin
-
- South America is responsible for the largest share in our split, but also for the biggest decline over the last 1.5 years, with Brazil, Colombia and Venezuela strongly overcompensating the additions from Guyana. More recently, Brazil saw a pull back in volumes sent to Asia in April. Only 673,000b/d departed for Asia in April versus 960,000 b/d the previous month and 1.54mn b/d in April 2020. A lull in new project commissioning over the coming months means the upside for Brazilian volumes is limited.
- Another big player with massive declines is West Africa. Some of the reduction in flows is linked to OPEC+ policies, but natural decline is a big issue in all major countries in the region. Anybody betting on a strong recovery in line with relaxed OPEC+ arrangements could be easily disappointed.
- This is a completely different story in the Baltics and the Black Sea, where at least Russian supplies are set to recover significantly in line with easing OPEC+ restrictions. Supplies have already come back by 600,000 b/d over the last three months relative to a summer lull last year (Jul-Sep). A recovery to Q1 2020 volumes would imply another step higher by 600,000 b/d, but this potential is unlikely to be fully reachable any time soon, at least as long as OPEC+ market management remains in place, while some natural declines may very well have also materialised in Russia and the Caspian region.
- US and other Central and North American supplies increased by more than 300,000 b/d from March to April. It is fair to say that the US has recovered from the February freeze, considering April’s 3.1 mn b/d of exports are at par with the average of H1 2020. Liftings are expected to continue at about this pace throughout the summer but meaningful growth seems unlikely.
- As for the Mediterranean, the return of Libyan barrels to the market has been the defining factor. Libyan output came in over 1 mn b/d for the seventh consecutive month in April after failing to break 200,000 b/d in April 2020. An upper boundary may now be reached, and further growth in exports would require additional upstream activity and investment.
- North Sea flows fell by nearly 300,000 b/d m-o-m in April to 2.1 mn b/d. Heavier North Sea grades are getting sold to Asia at a high pace, especially Johan Sverdrup, while the lighter grades tend to stay in the region. The maintenance program in the North Sea is expected to keep a lid on European flows through the summer.
For the Atlantic Basin as a whole, crude supply growth has been range-bound since last summer, and barely any additional supply can be expected over the coming months. In fact, maintenance in the North Sea and natural decline in many markets, may well more than compensate for any easing of OPEC+ limitations.
There is however an interesting dynamic visible, when comparing shipments from the Atlantic Basin’s eastern shores (Africa, wider Europe) to those from the Americas. Over the last three months, the former have supplied 3.4 mn b/d more than the latter, a massive 2.8 million b/d swing from summer last year (Jul-Sep). This underpins the excellent crude supply disposition of European refiners, providing at least one upside in an otherwise dull market.
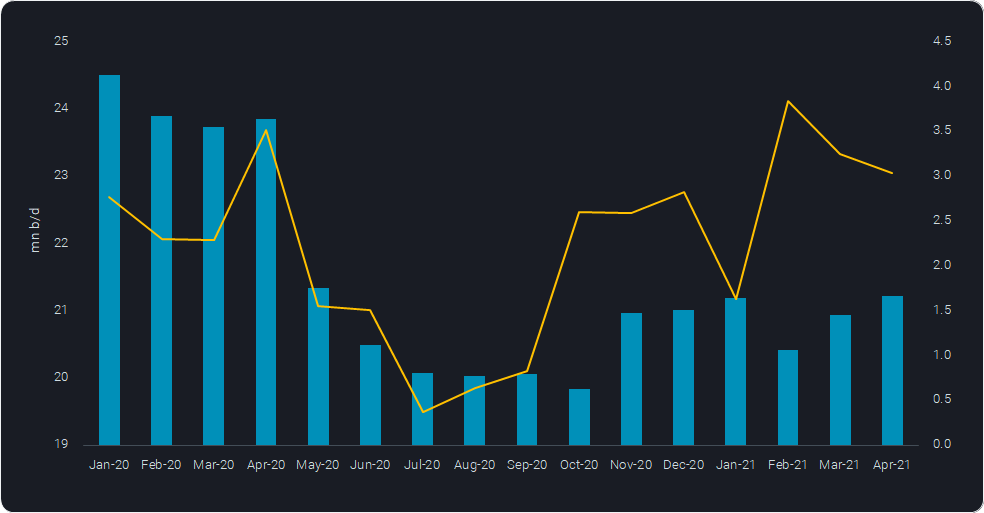
Atlantic Basin Crude Departures (bars), Eastern vs Western Atlantic Basin (line, RHS)
Want to get the latest updates from Vortexa’s analysts and industry experts directly to your inbox?
{{cta(‘cf096ab3-557b-4d5a-b898-d5fc843fd89b’,’justifycenter’)}}
More from Vortexa Analysis
- May 18, 2021 US led resupply needs give a boost to waterborne gasoline cargoes
- May 17, 2021 Crude tanker delays as cyclone hits WC India
- May 12, 2021 Mega shipments cannibalising the LR2 market
- May 11, 2021 LNG flows reviving in line with global recovery
- May 10, 2021 Colonial outage – Implications on seaborne trade


