Big oil producers shine as refiners
Vortexa analyses competitive advantages of different refining setups and concludes from product export data that refiners in oil producing countries are currently outperforming plants in consuming nations thanks to feedstock costs.
Any refinery around the world is a unique industrial plant. It is a combination of different units enjoying a distinguished sales market and specific feedstock options that are closely related to its location and infrastructure connections. Competitive advantages or disadvantages will hinge on all these factors and their combination. While again unique, certain patterns can be generalised somewhat, which we will do in this blog.
We will focus particularly on feedstock costs and location. As for the latter, refiners can be located close to feedstock supply, with most US, Russian and Middle Eastern refiners falling into this bracket, amid others. Or they can be located close to consumption hubs, including most of the Asian and European downstream industry. You may also single out processing hubs that are located somewhat in between, enjoying neither loads of local feedstock, nor much local final product needs. A combination of superior set-ups, economies of scale and integration, and a location along major trade routes helps to make up for this. For the purpose of this article, we have grouped Belgium, Netherlands, Singapore, but also (somewhat arbitrarily) India, Italy and South Korea into this segment, called “Asian and European refining hubs”.
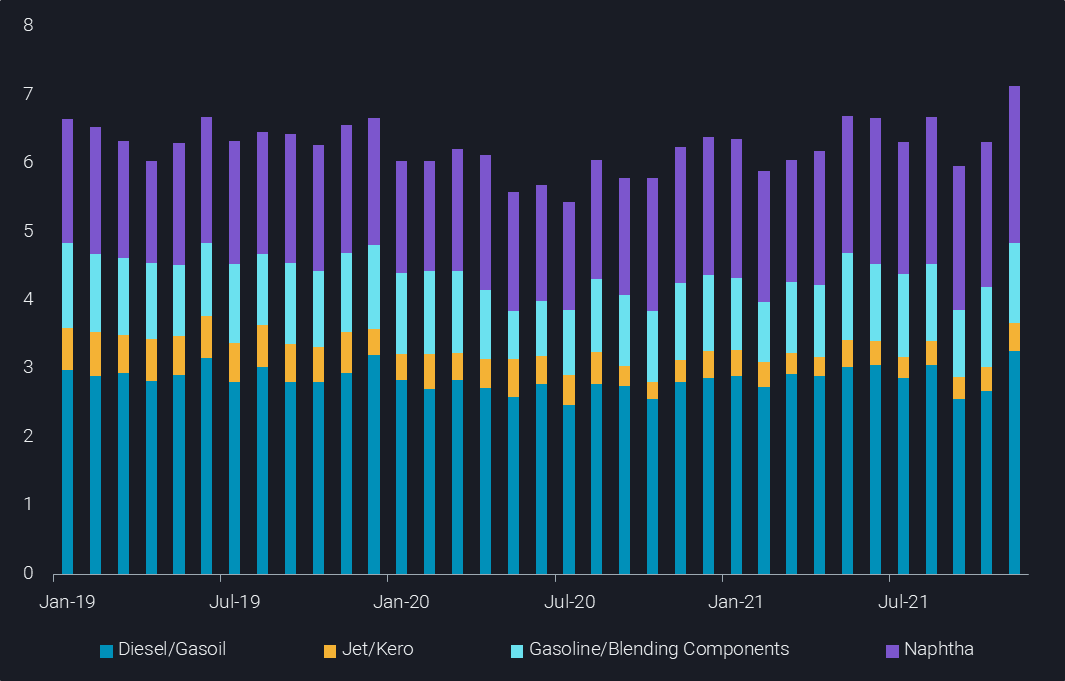
Exports of selected clean products from Russia, United States and Middle East (mbd)
As for feedstock costs, the basic focus is on crude oil, containing most of the molecules making up the final product supply. But there is more to it, as refineries need a lot of energy in the form of heat/steam and electricity to operate their units, equalling mostly between 5% and 10% of the crude oil input equivalent. This energy partly comes from processed crude oil in the form of intermediate and finished products (refinery gases, LPG, coke, ?), and partly also from imported electricity or natural gas. The latter is also needed to produce a chunk of hydrogen supplies, required for desulphurisation. Finally, carbon allowances, that are currently at record levels of $100/t in Europe (Argus Media), could also be added to the feedstock costs, for compliance reasons.
Refining advantage for crude producers
In very rough terms, refiners in oil producing countries will usually enjoy lower feedstock costs, while refiners close to final consumption enjoy higher product prices. For instance, European refiners enjoy the highest diesel prices in the world, as the region is short, with barrels travelling from all over the world to Europe. To make this possible, the diesel has to be much cheaper in the origin country. This leads us to another crucial factor, freight costs. Refiners in consuming countries are structurally favoured by lower freight costs for crude oil as compared to refined products, largely a question of economies of scale.
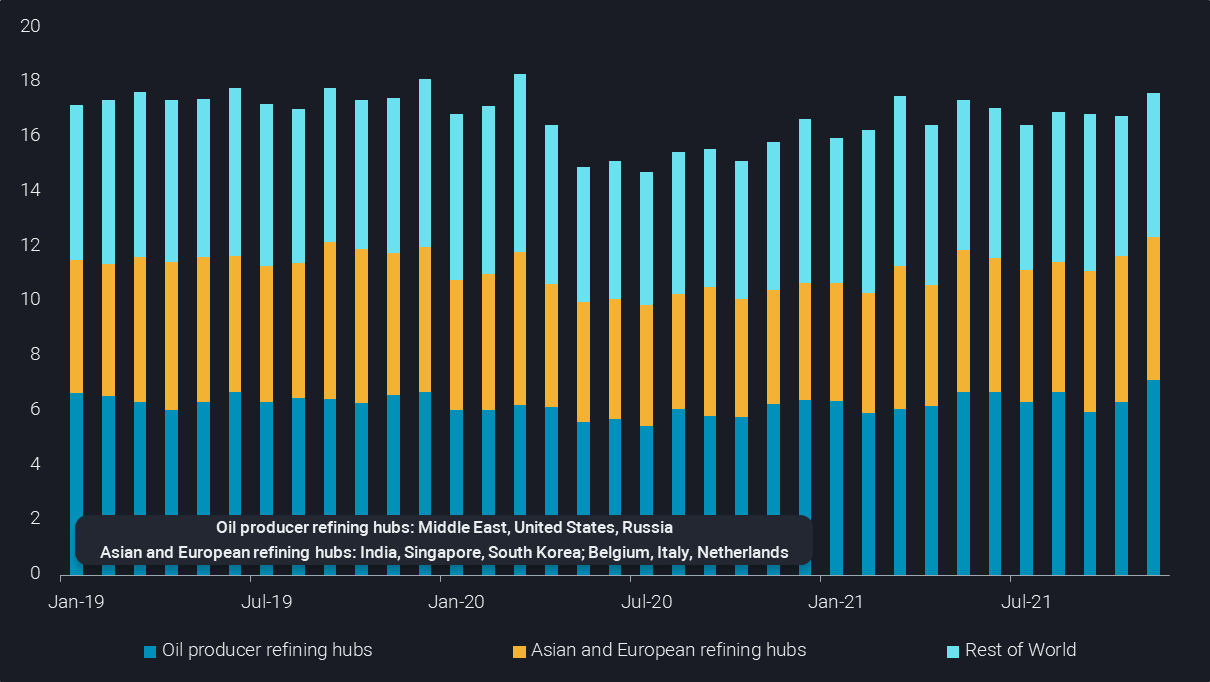
World gasoline, naphtha, jet/kero and diesel exports split by origin (mbd)
After all that, let’s get to the concrete observations. Vortexa flow data can help to decipher the latest trends in refining on a global scale, by analysing crude and product flows. We focus here on the main clean product exports – gasoline and blending components, naphtha, jet/kero and diesel/gasoil. In November, we recorded global exports of these products at 18.2mbd, up 0.8mbd m-o-m, marking the highest level since March 2020. This monthly increase is stemming entirely from the Middle East, Russia and the United States, the group we refer to as “oil producer refining hubs” in this analysis. This group’s November exports of the main clean products hit 7.2mbd, the second highest in our dataset after April 2018. The volume is up by 0.8mbd from the Jan-Oct 2021 average and 1.2mbd stronger than the 2020 average.
Divergences in the global downstream recovery
The question is now whether this increase singles out oil producer refining hubs from other refiners in the world. For that purpose we look at the main clean product exports vs the average of 2019 by group of refiners (see chart below). It is evident that all three groups, oil producer refining hubs, Asian and European refining hubs and the Rest of World have seen similar declines in exports when Covid-19 hit global markets in Q2 2020. The first phase of the recovery was then dominated by the Rest of World, possibly because they increased runs in line with local demand recovery.
Since May 2021 however it is clearly the oil producer refining hubs who have won the recovery race. In four of the last seven months, the US, Russia and the Middle East have exported more main clean products than on average in 2019. The Rest of World has fallen back into relative losses, which especially over the last two months are of similar extent than peak 2020 losses. The refining hubs in Asia and Europe are back to normal levels over the last three months.

World gasoline, naphtha, jet/kero and diesel exports split by origin – change vs 2019 average (mbd)
The question is whether there is a clear reason for this pattern, and our answer is yes, surging feedstock costs. LNG prices have risen about six-fold since spring, EU carbon allowances have tripled since the start of the year, and crude oil prices are some $25/b higher than at the start of the year, despite a recent correction (Argus Media). And while the trend has been there largely throughout the year, most of the price surge came over the last three months. Even with the emergence of Omicron, feedstock costs are pretty likely to remain highly elevated over the coming months and potentially 2022 as a whole.
In conclusion, November may have just marked the beginning of a longer trend of elevated refinery runs in oil producing countries, as these players enjoy much lower energy costs. This is especially the case for natural gas, where domestic prices are usually only a tiny fraction of the global LNG price level.
With carbon costs and longer-term demand risks being relevant factors beyond Covid reverberations, it is well plausible that refining may shift – at the margin – from oil consumer to oil producer countries on a more permanent basis. If so, it would sustain clean tanker demand relative to dirty vessels, potentially underpinning the ongoing dirty-to-clean shift in the Aframax/LR2 segment.
More from Vortexa Analysis
- Dec 8, 2021 Russia and Ukraine: What’s at Stake for Oil?
- Dec 7, 2021 LPG flood reaches Asia and Europe in December
- Dec 2, 2021 Omicron obscures outlook for tanker markets
- Dec 1, 2021 Rising flows, wrong time?
- Dec 1, 2021 What a time(ing)!?
- Nov 25, 2021 Clean tankers battle it out in the Atlantic and the Middle East
- Nov 23, 2021 How helpful is the US-led SPR release
- Nov 23, 2021 Asia’s gasoline cracks make an unexpected U-turn
- Nov 18, 2021 Asia’s crude appetite sweetens in November


