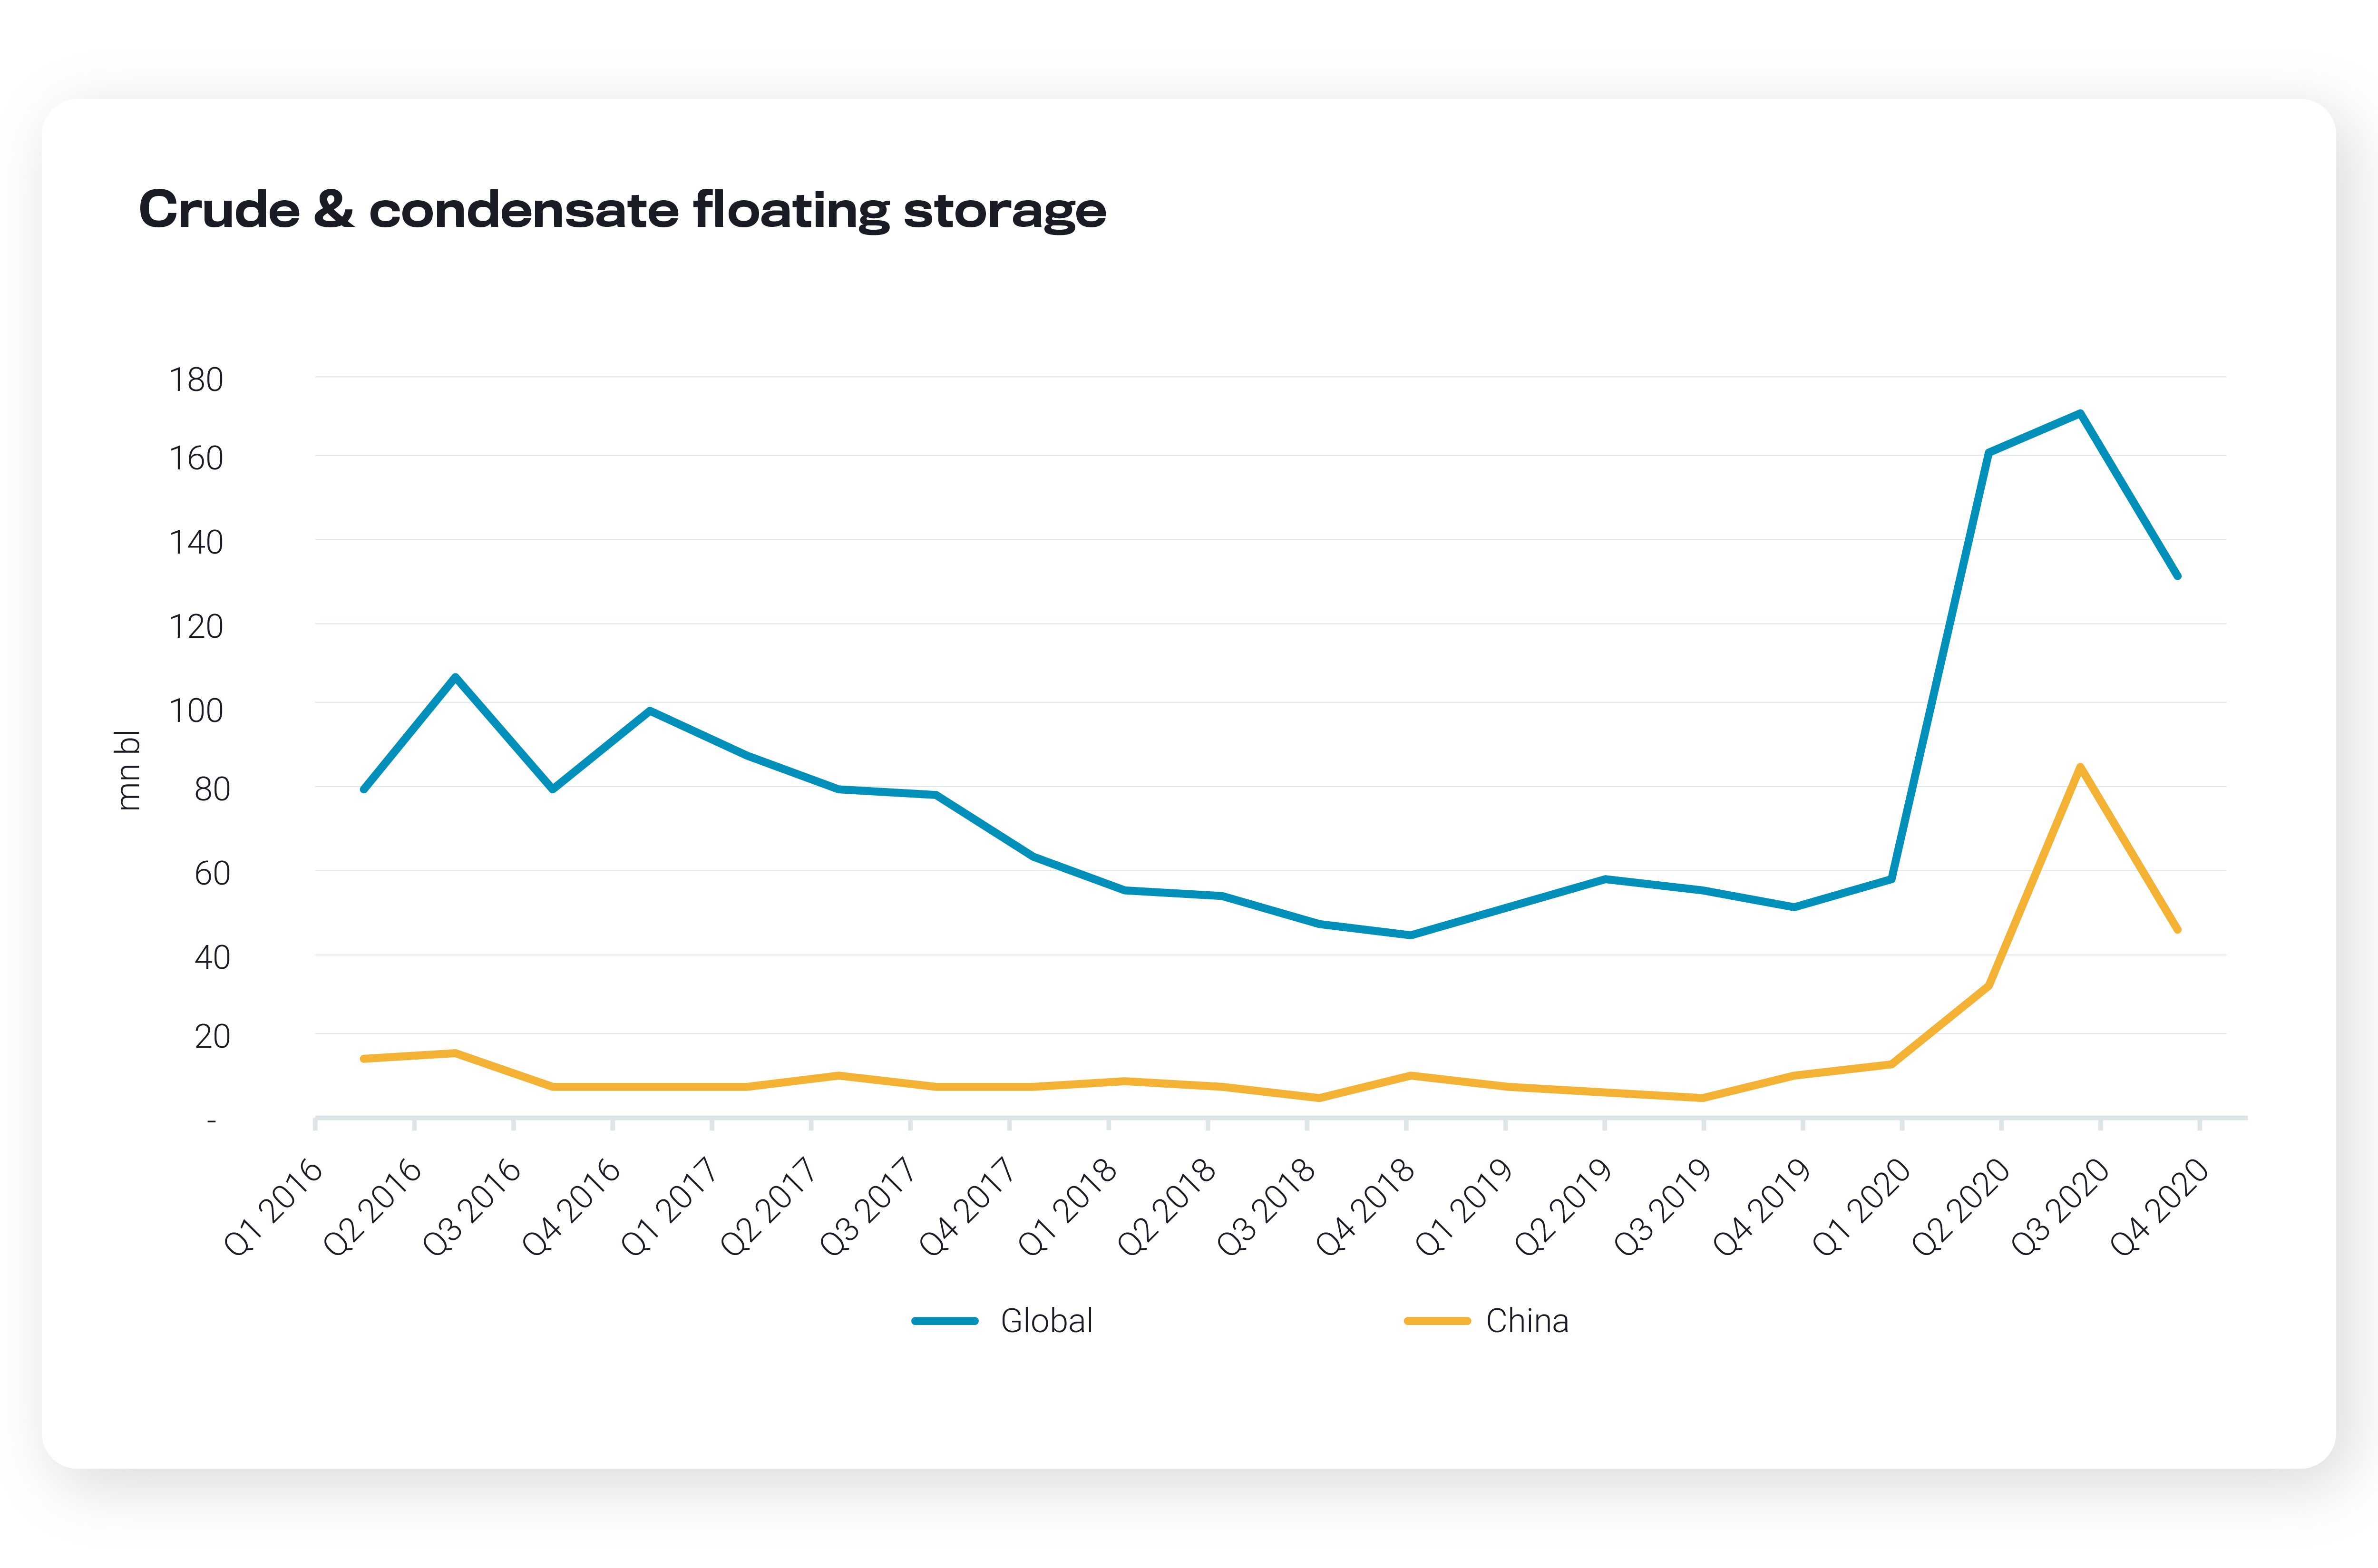
Floating storage told the story of the extraordinary moves in oil demand and supply in 2020. Tankers holding offshore stocks of crude and refined products at sea made the news repeatedly from Q2 onwards, as volumes hit record highs amid a dramatic slump in demand, and also upended tanker market dynamics. Some traders took advantage of the initial profitability to store oil at sea on account of the steep contango that emerged. Other types of floating storage pointed to the logistical difficulty in suddenly moving huge volumes barrels into onshore storage or refineries.
Below we review the pace and spread of floating storage and the impact on the freight market in 2020. With a persistent oversupply expected to carry into 2021, the rise and fall of floating storage, looks set to keep making waves.
-
The pace of the build
- Global crude and condensate in floating storage peaked at a record daily rate of over 215mn bl at the end of June. Volumes congested off China accounted for half of the global total over Q3 due to the massive volume of arrivals following the buying spree when prices crashed. Barrels floating there started to draw down more rapidly from October onwards, eventually pulling down global levels to around 100mn bl by the beginning of December 2020. But that’s still almost double the levels Vortexa saw prior to March this year.

Historical crude & condensate in floating storage by quarter See this in the Vortexa platform
Global clean petroleum products (CPP) in floating storage – namely diesel, gasoline and jet – hit a combined record daily high of over 100mn bl in mid-May, peaking and declining much faster than crude. But weaker European distillate markets kept volumes elevated – particularly in the second half of 2020, even as volumes in Asia began to stabilise in comparison. Global levels have fallen to around 30mn bl by the beginning of December, returning roughly to levels seen in February-March.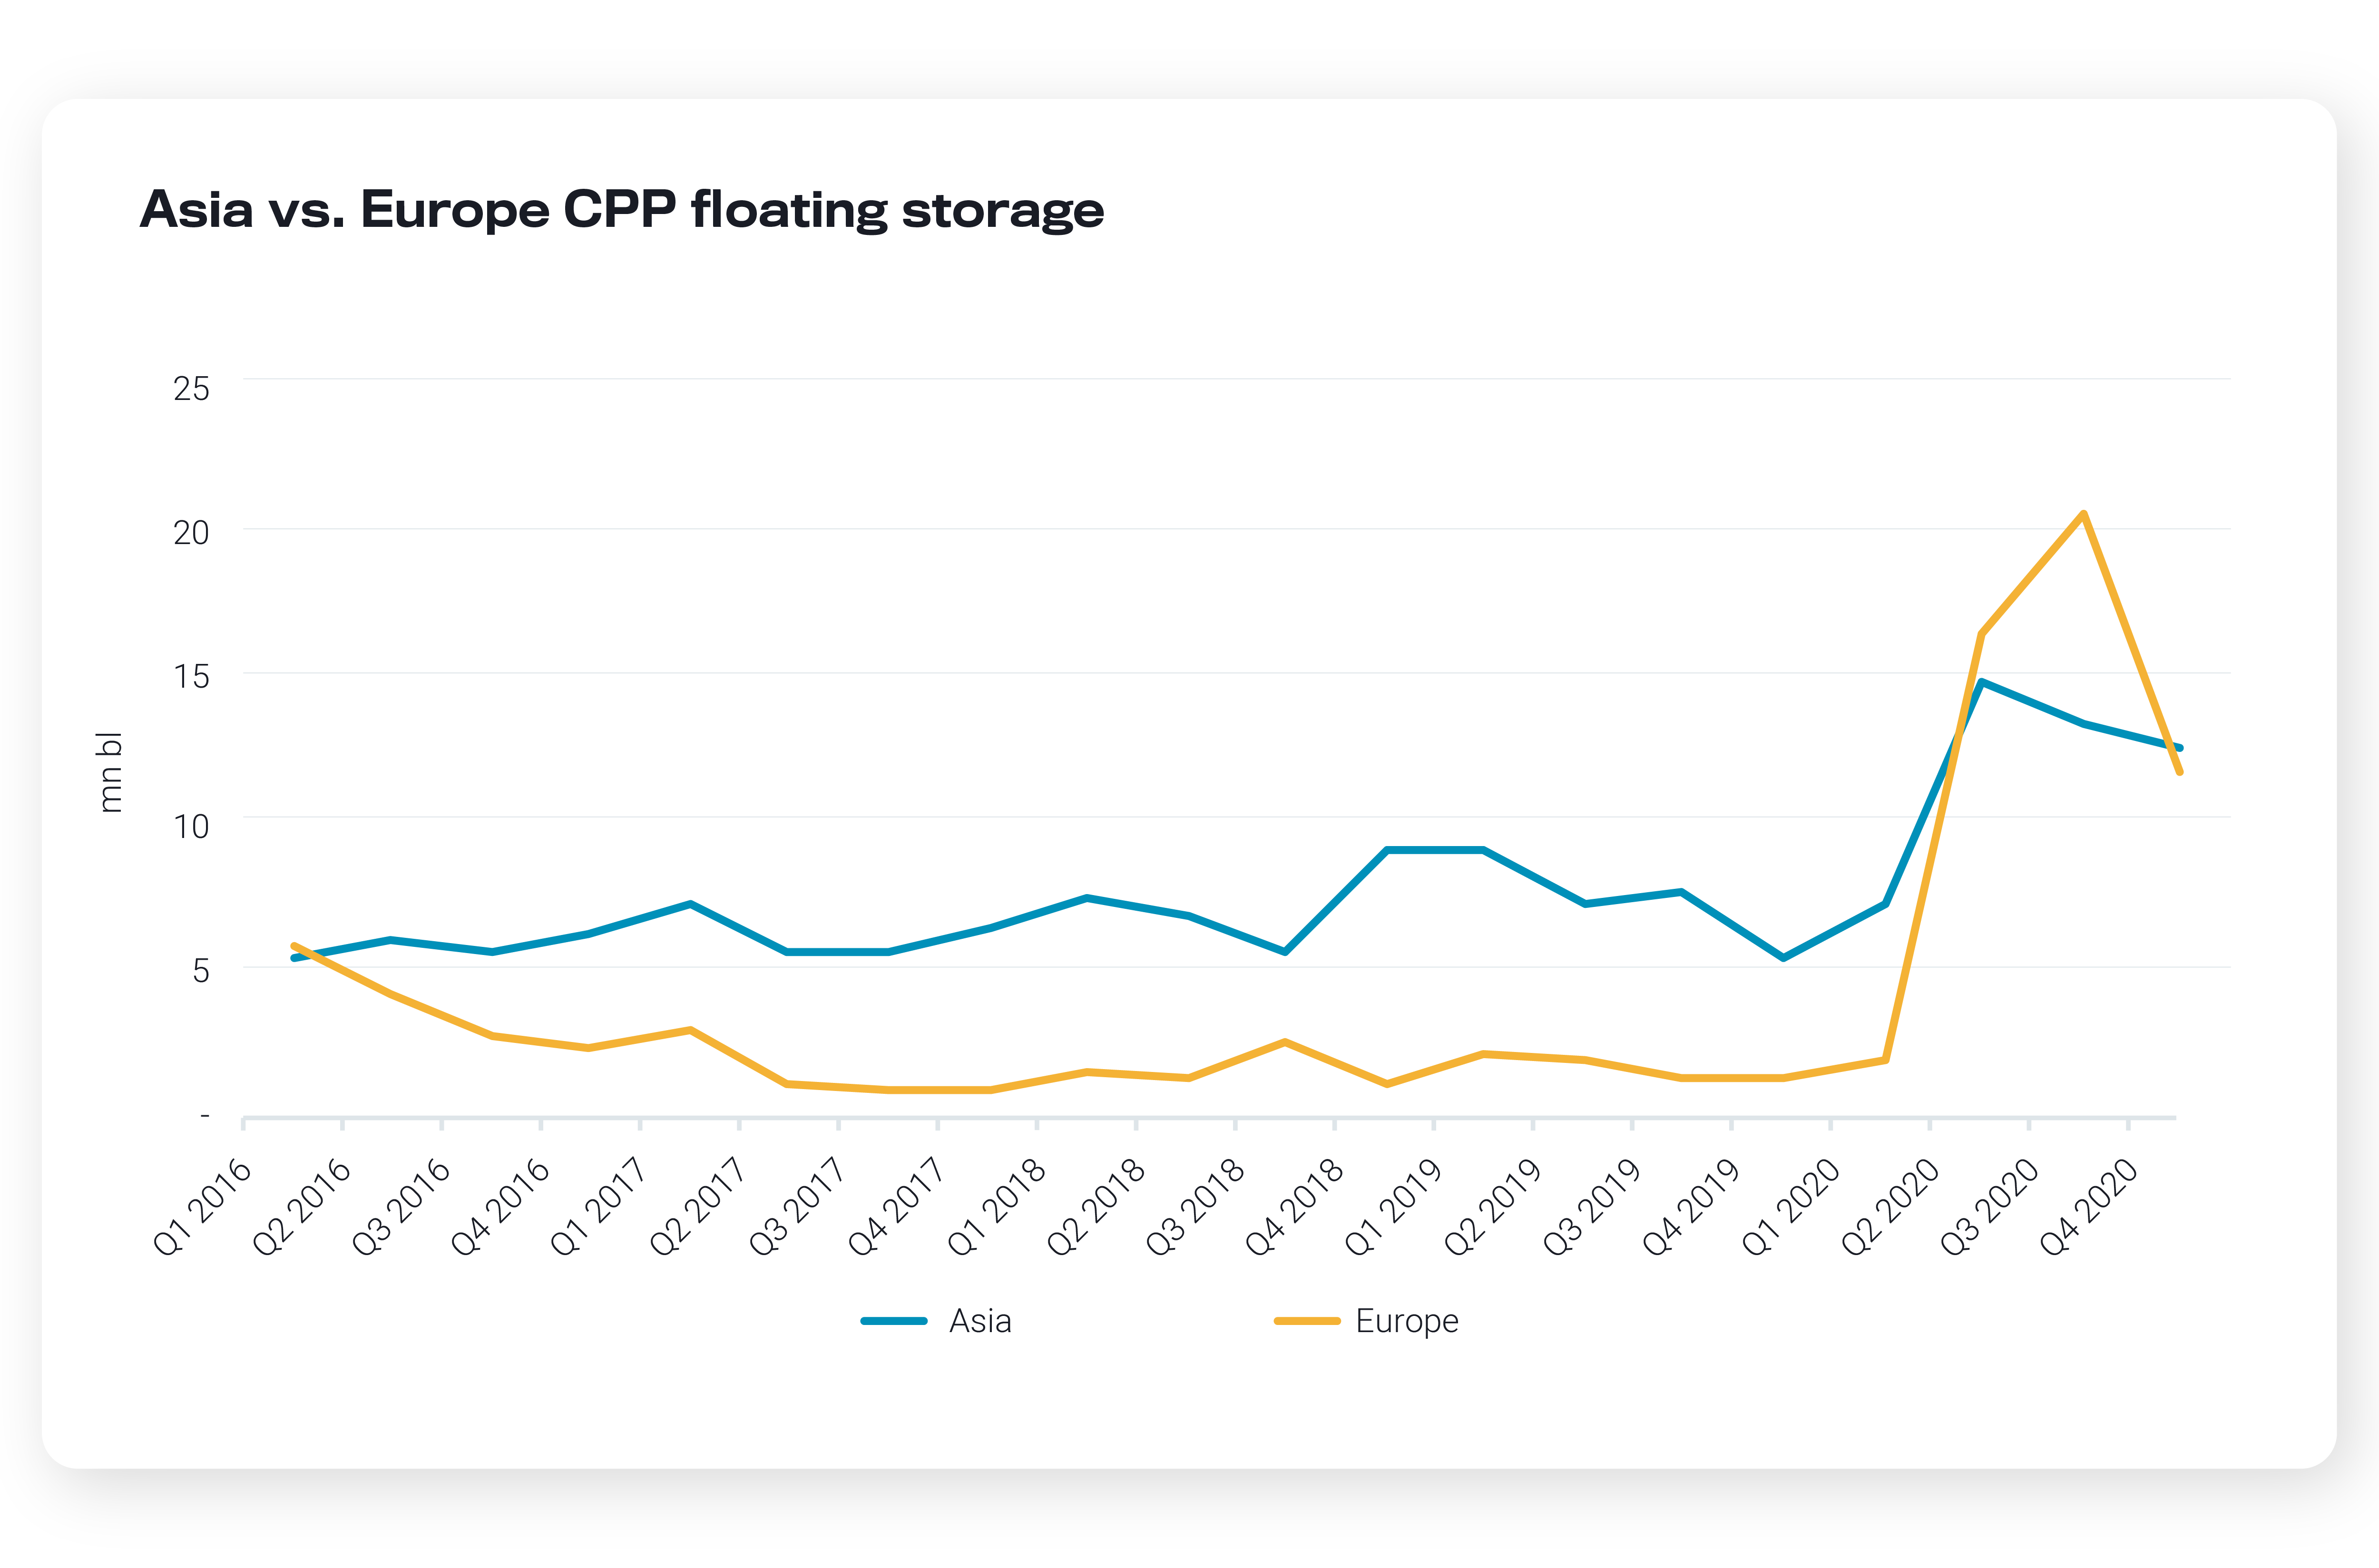
Historical CPP in floating storage by quarter See this in the Vortexa platform
The regional spread
On crude, floating storage volumes rose almost everywhere globally from the end of Q1/early Q2, when the build accelerated in earnest. This included barrels accumulating in unusual locations, such as the US West coast, as well as more typical floating storage areas such as Singapore/Malaysia and North West Europe. Moving into 2H 2020, floating storage volumes concentrated around China, buoying total levels across Asia. Thereafter, subdued demand conditions in Europe lifted that region’s share in floating storage during Q4, while the US volumes normalised and accounted for a much smaller share of overall global volumes. 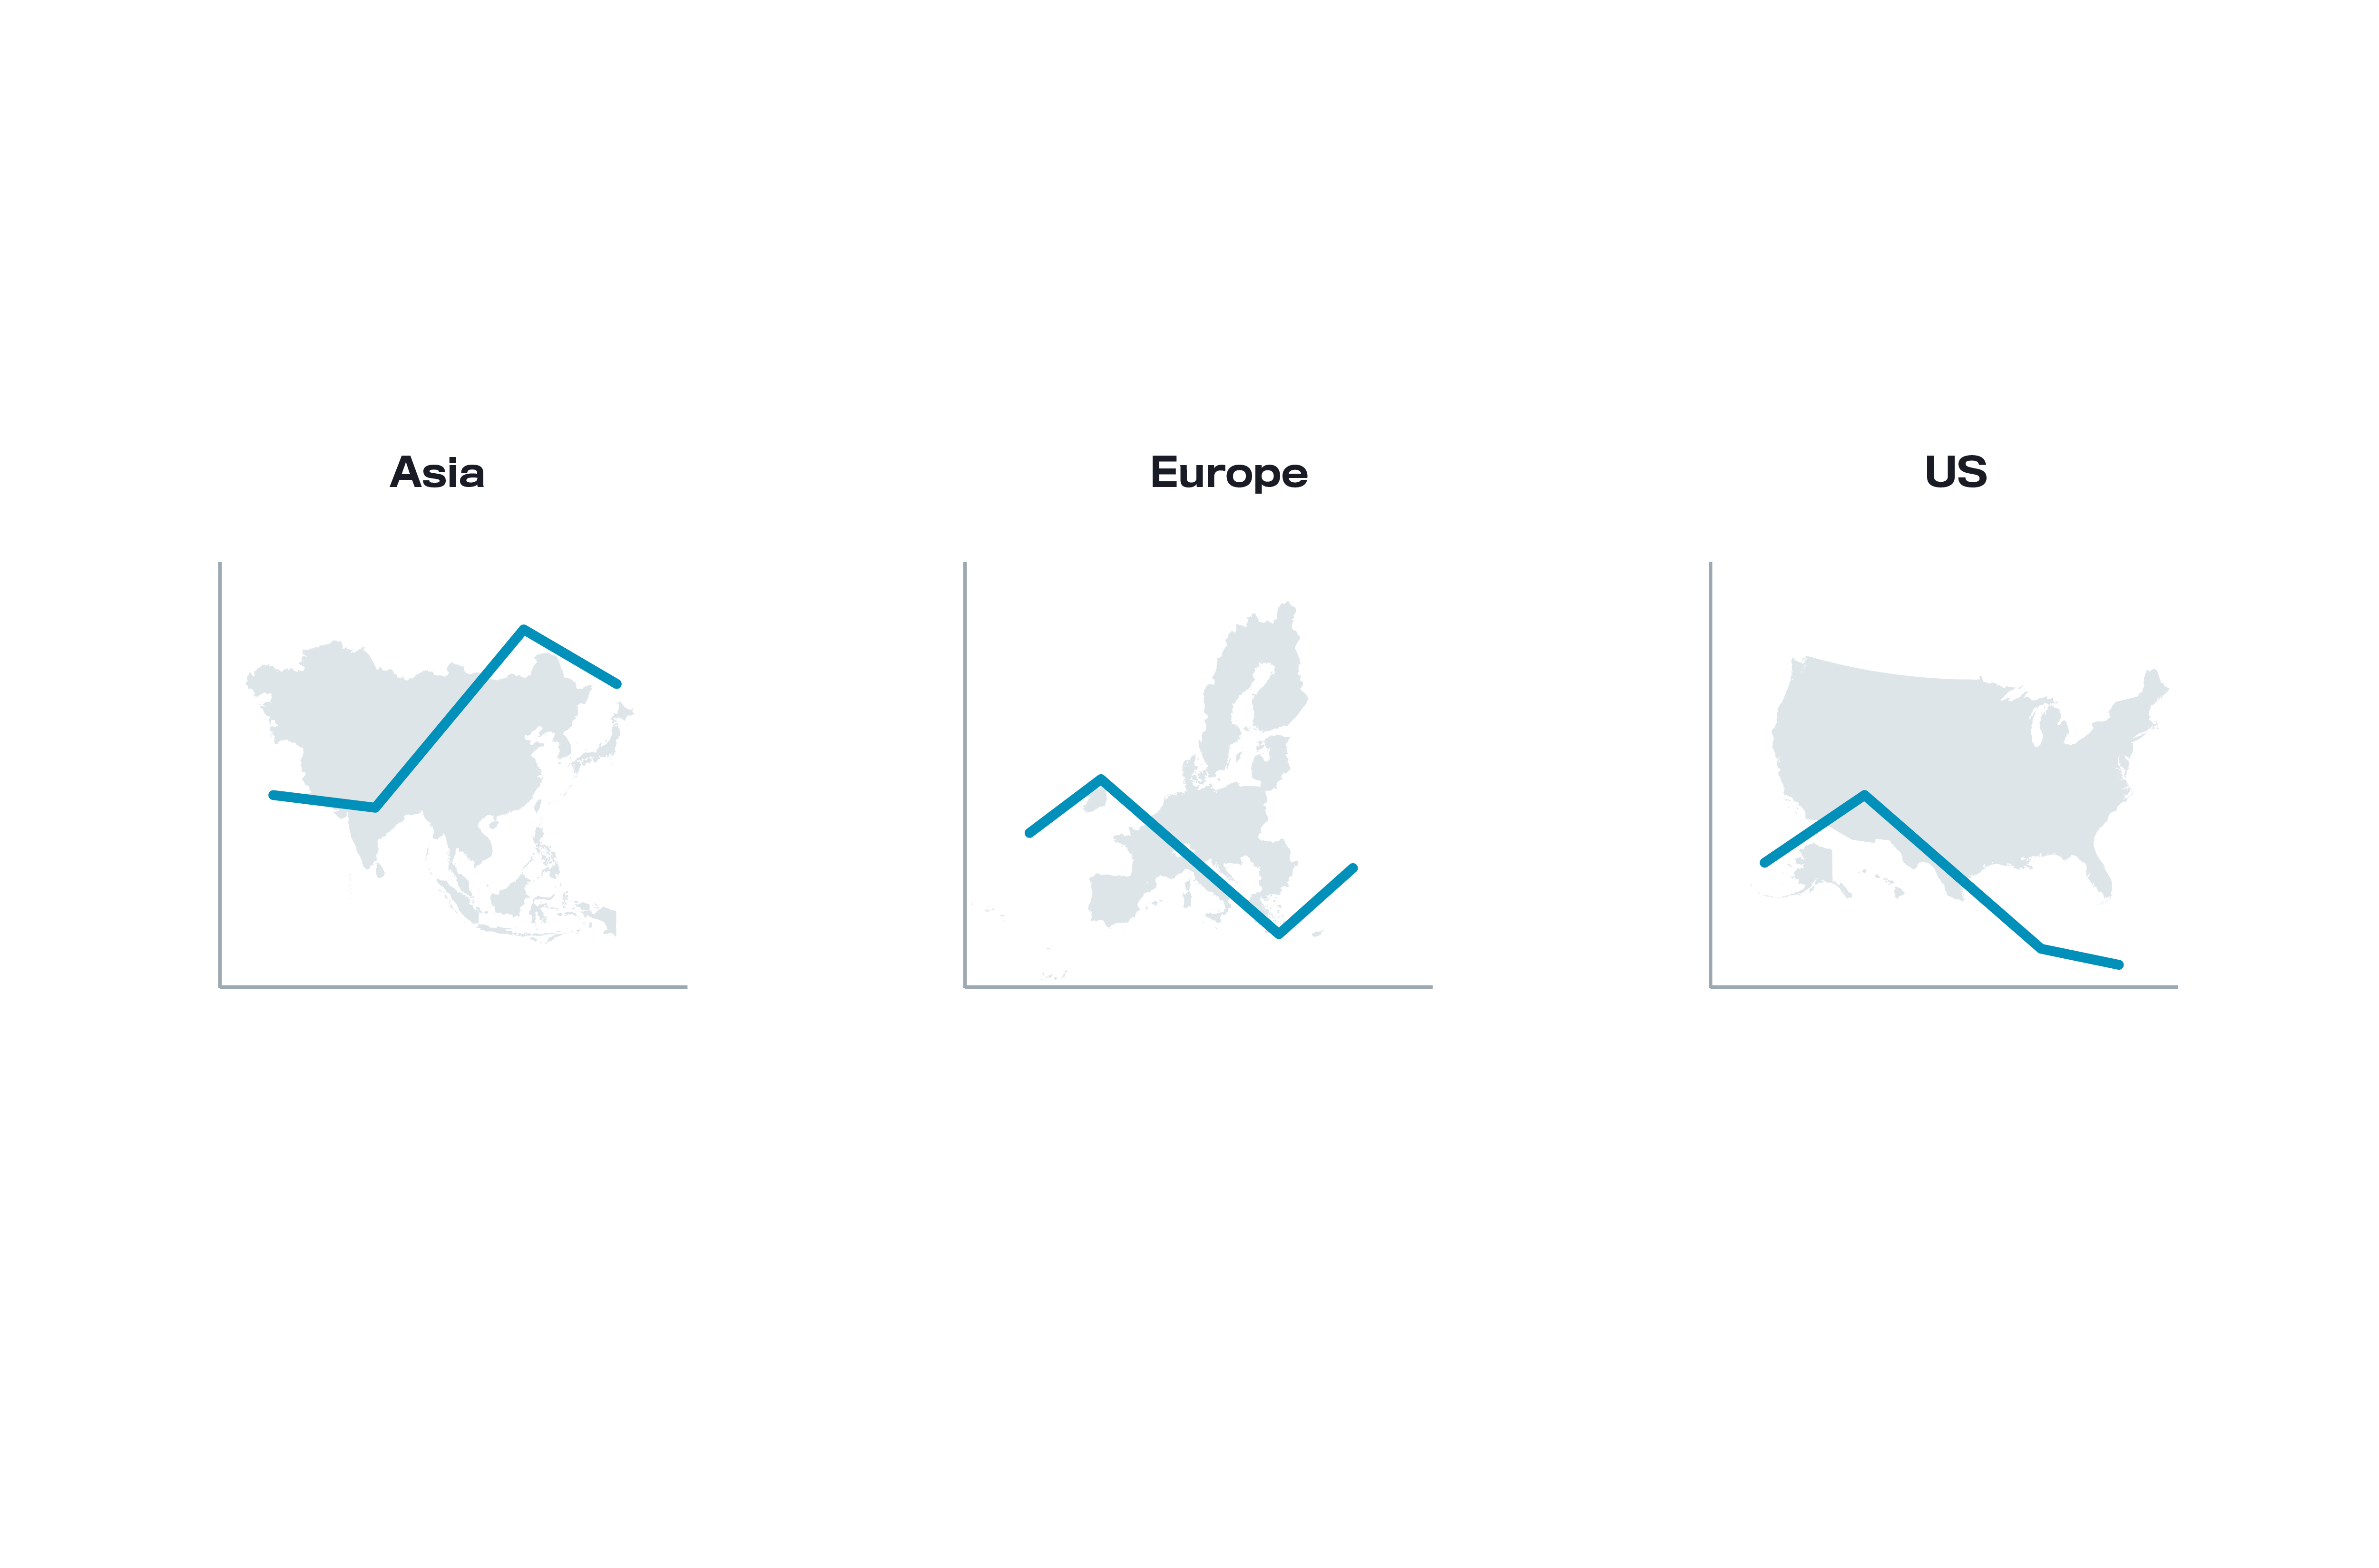
Regional share of global crude & condensate in floating storage in 2020
On clean petroleum products (CPP) – diesel, gasoline and jet – the regional share in floating storage was broadly equal between Asia and Europe, each accounting for around 20% in Q2. But as demand recovered faster in Asia than in Europe, that skewed to 25% in Asia vs. 40% in Europe in Q3, with a particular overhang in distillate products. Across the second half of the year, Europe has firmly retained the top spot for the largest share of global jet fuel in floating storage.
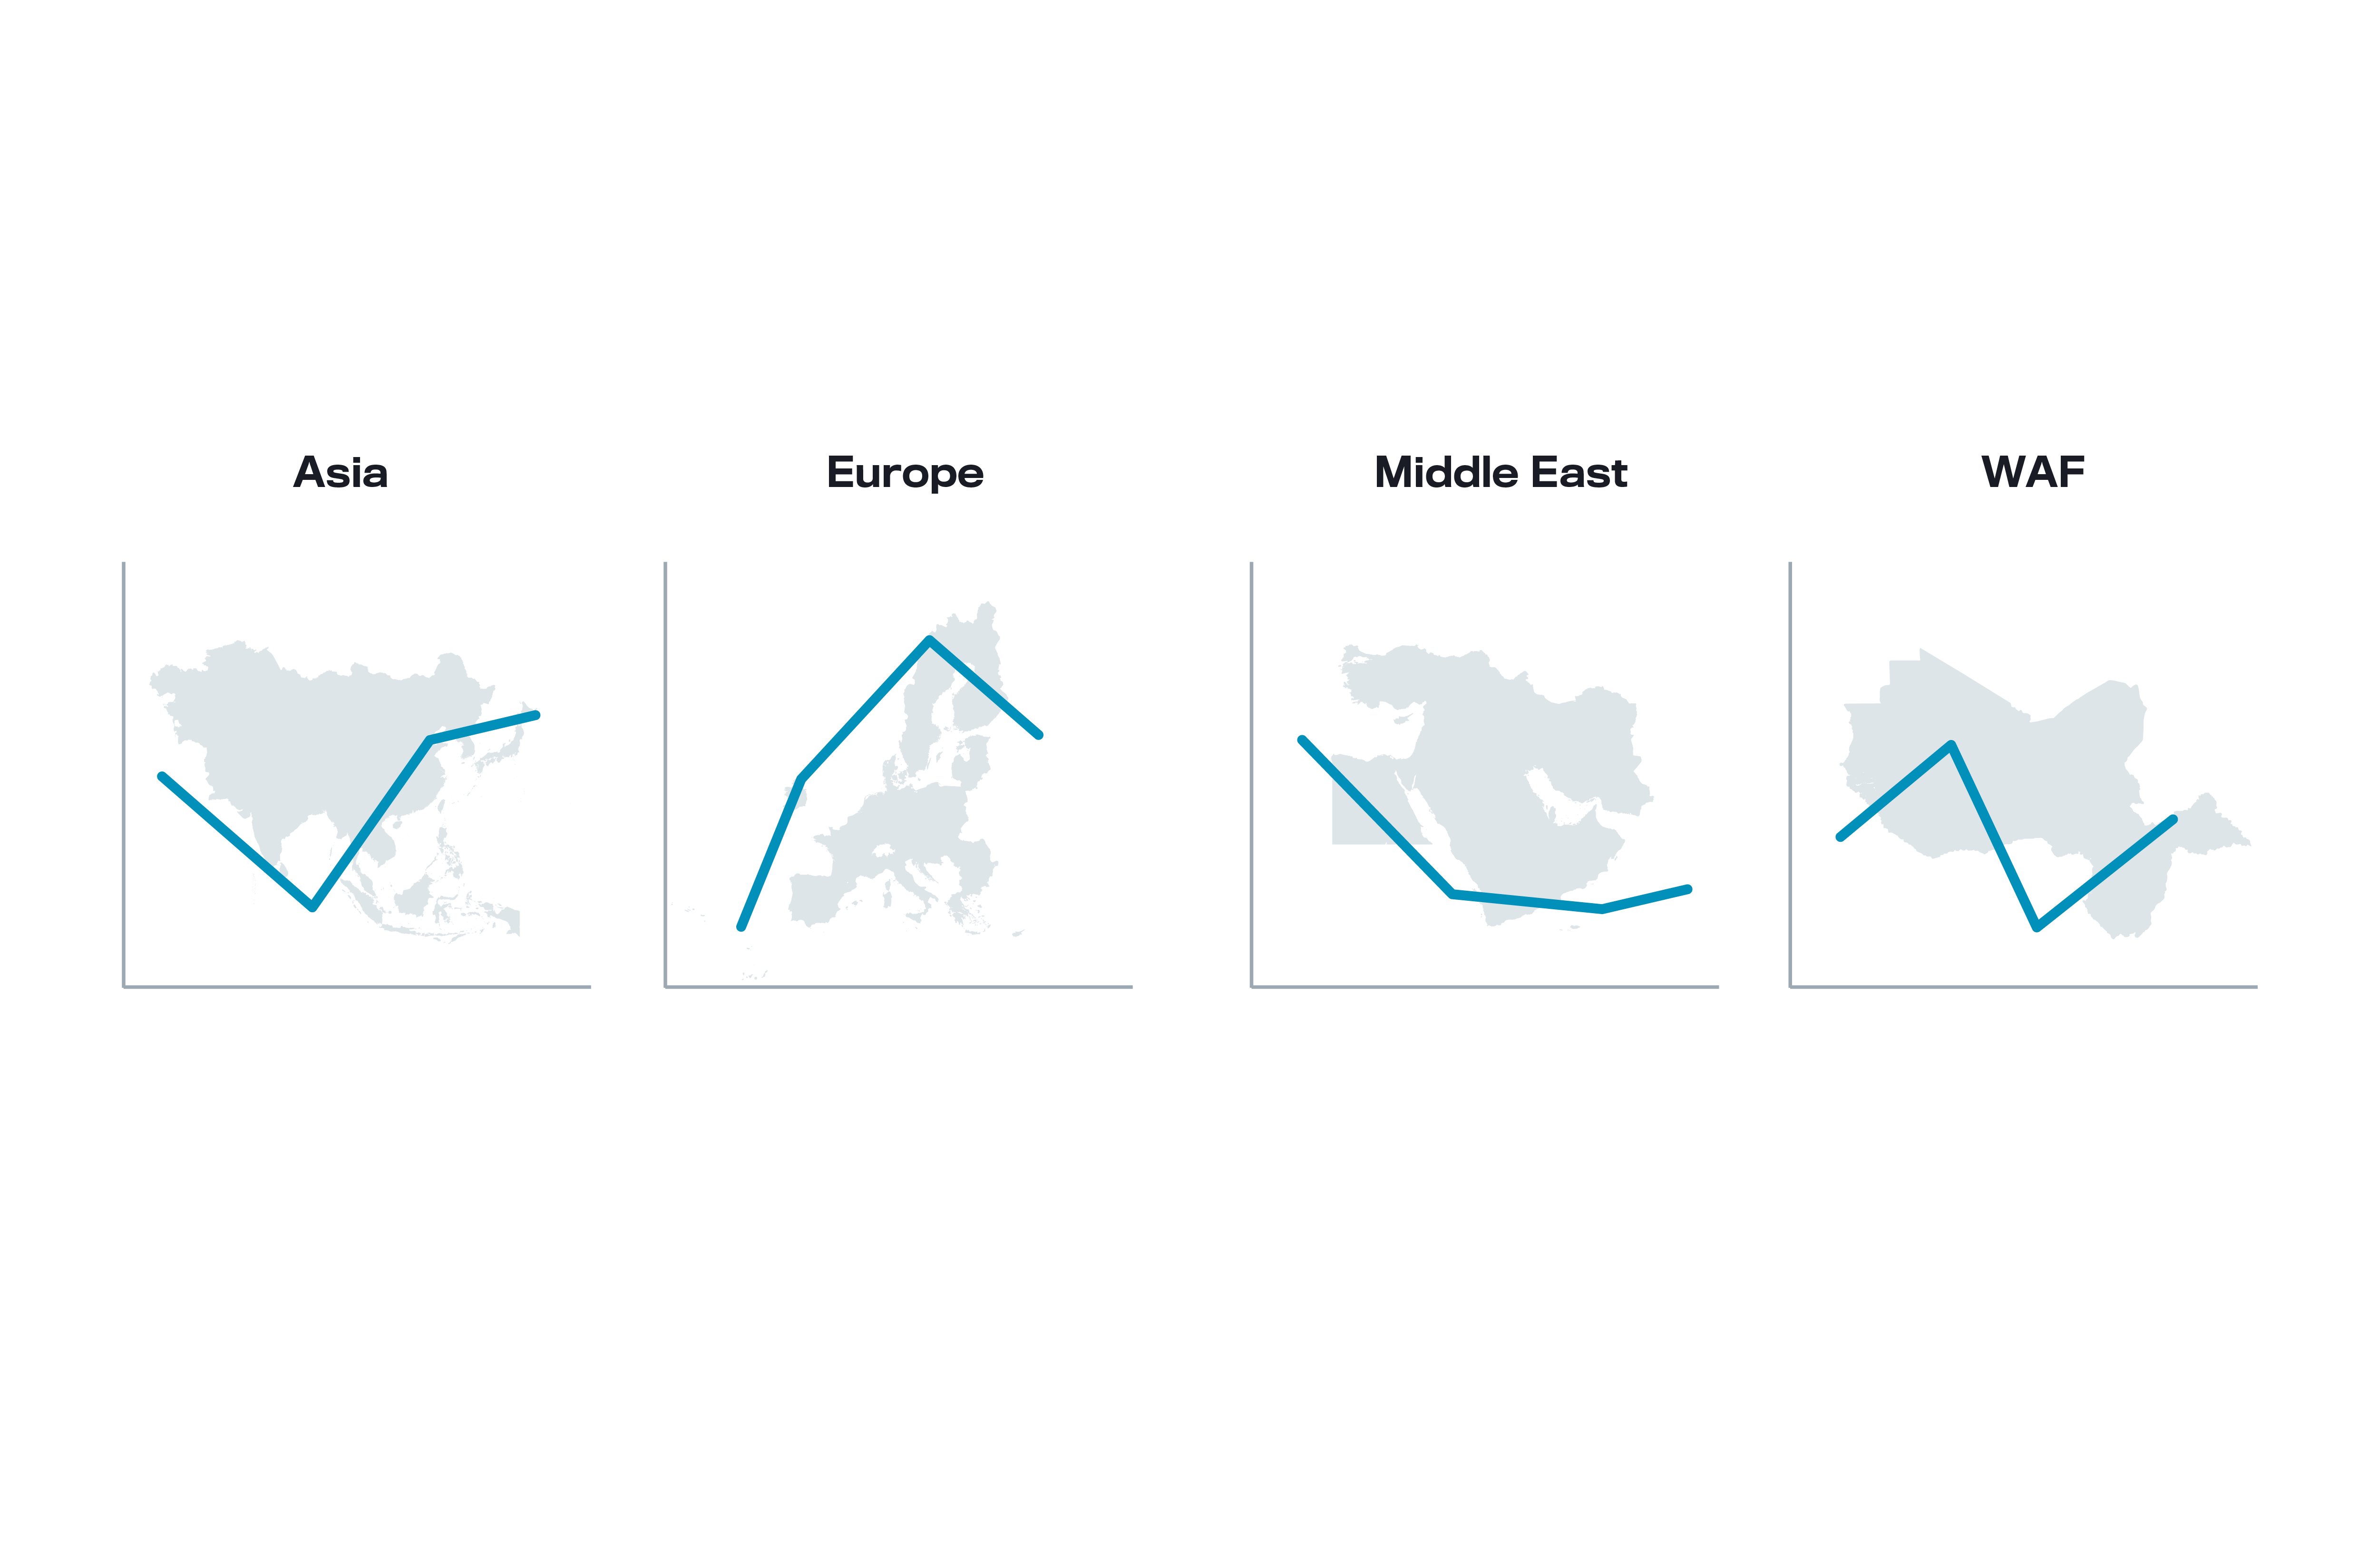
Regional share of CPP in floating storage in 2020
Freight Impact
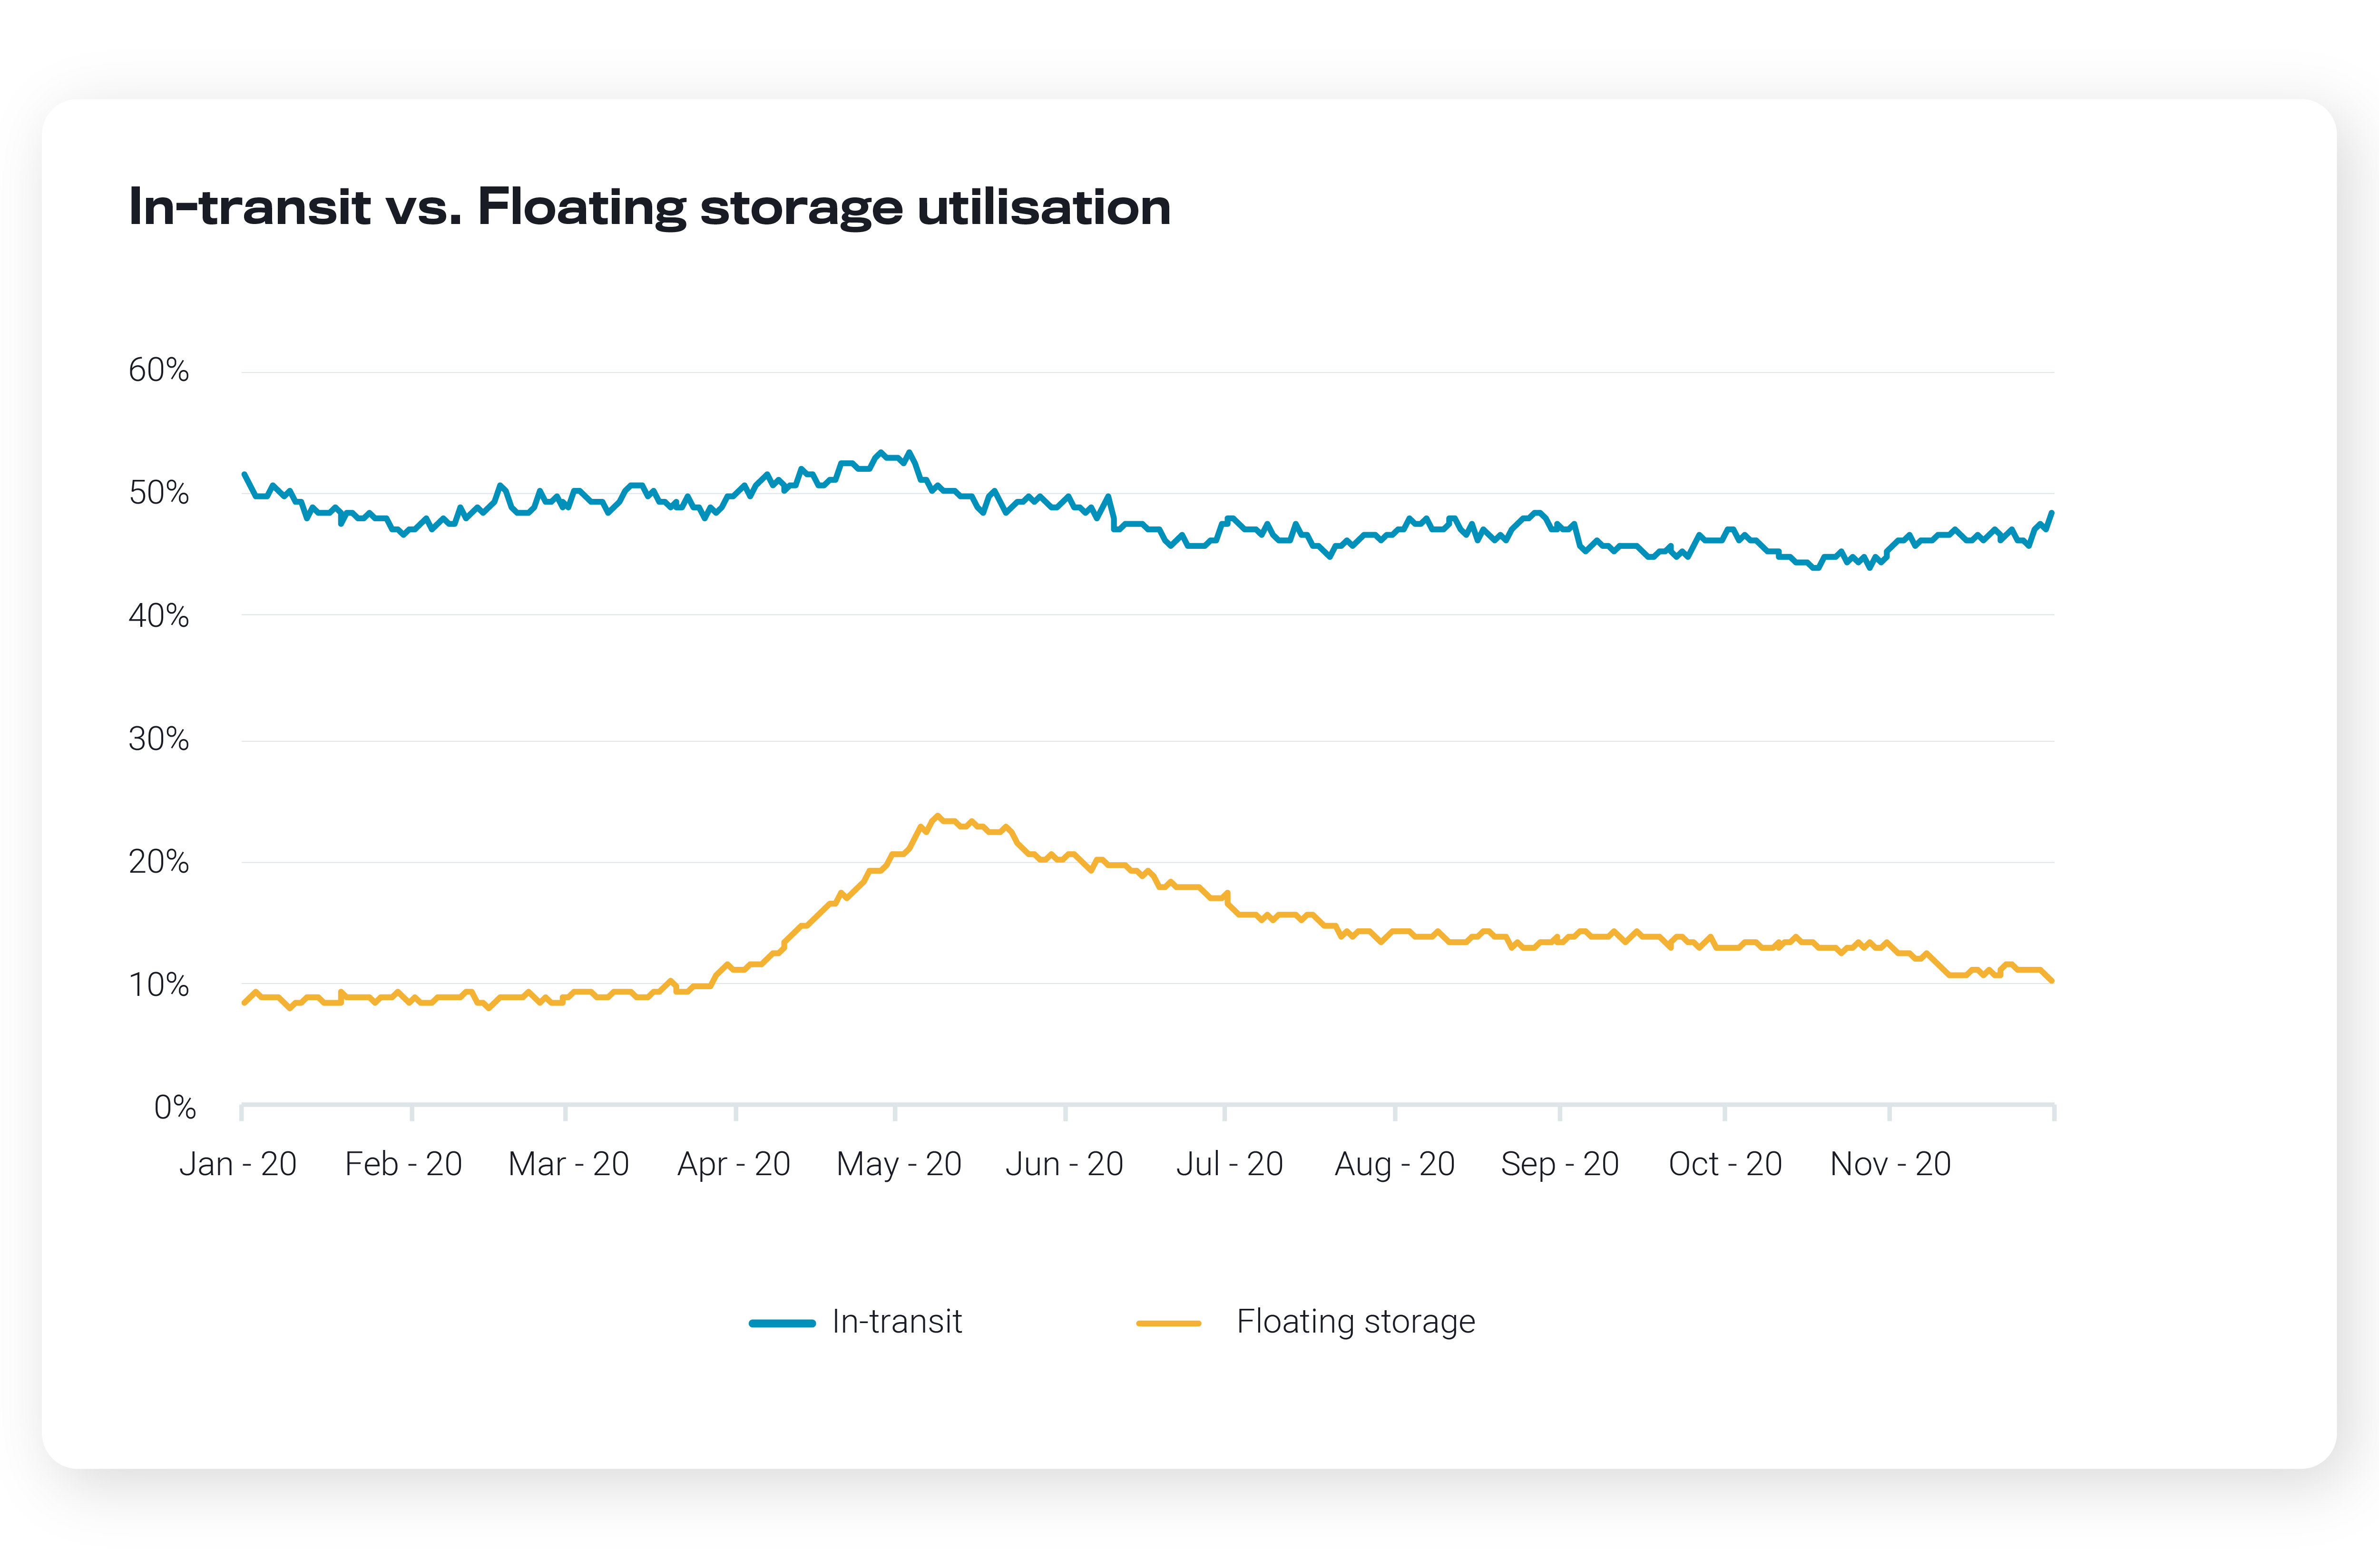
The build in floating storage was also reflected by the increase in utilisation of the tanker fleet for this purpose. Whilst levels hovered at 8-10% in Q1, the utilisation percentage rose higher in May-mid June. At its peak, close to a quarter of the total global tanker fleet (for all tankers Handysize and above) were deployed in floating storage, an all-time high according to Vortexa data. By end-November, utilisation in floating storage for the global tanker fleet had reverted to pre-pandemic levels as tankers were gradually released from floating storage duties after Q2.
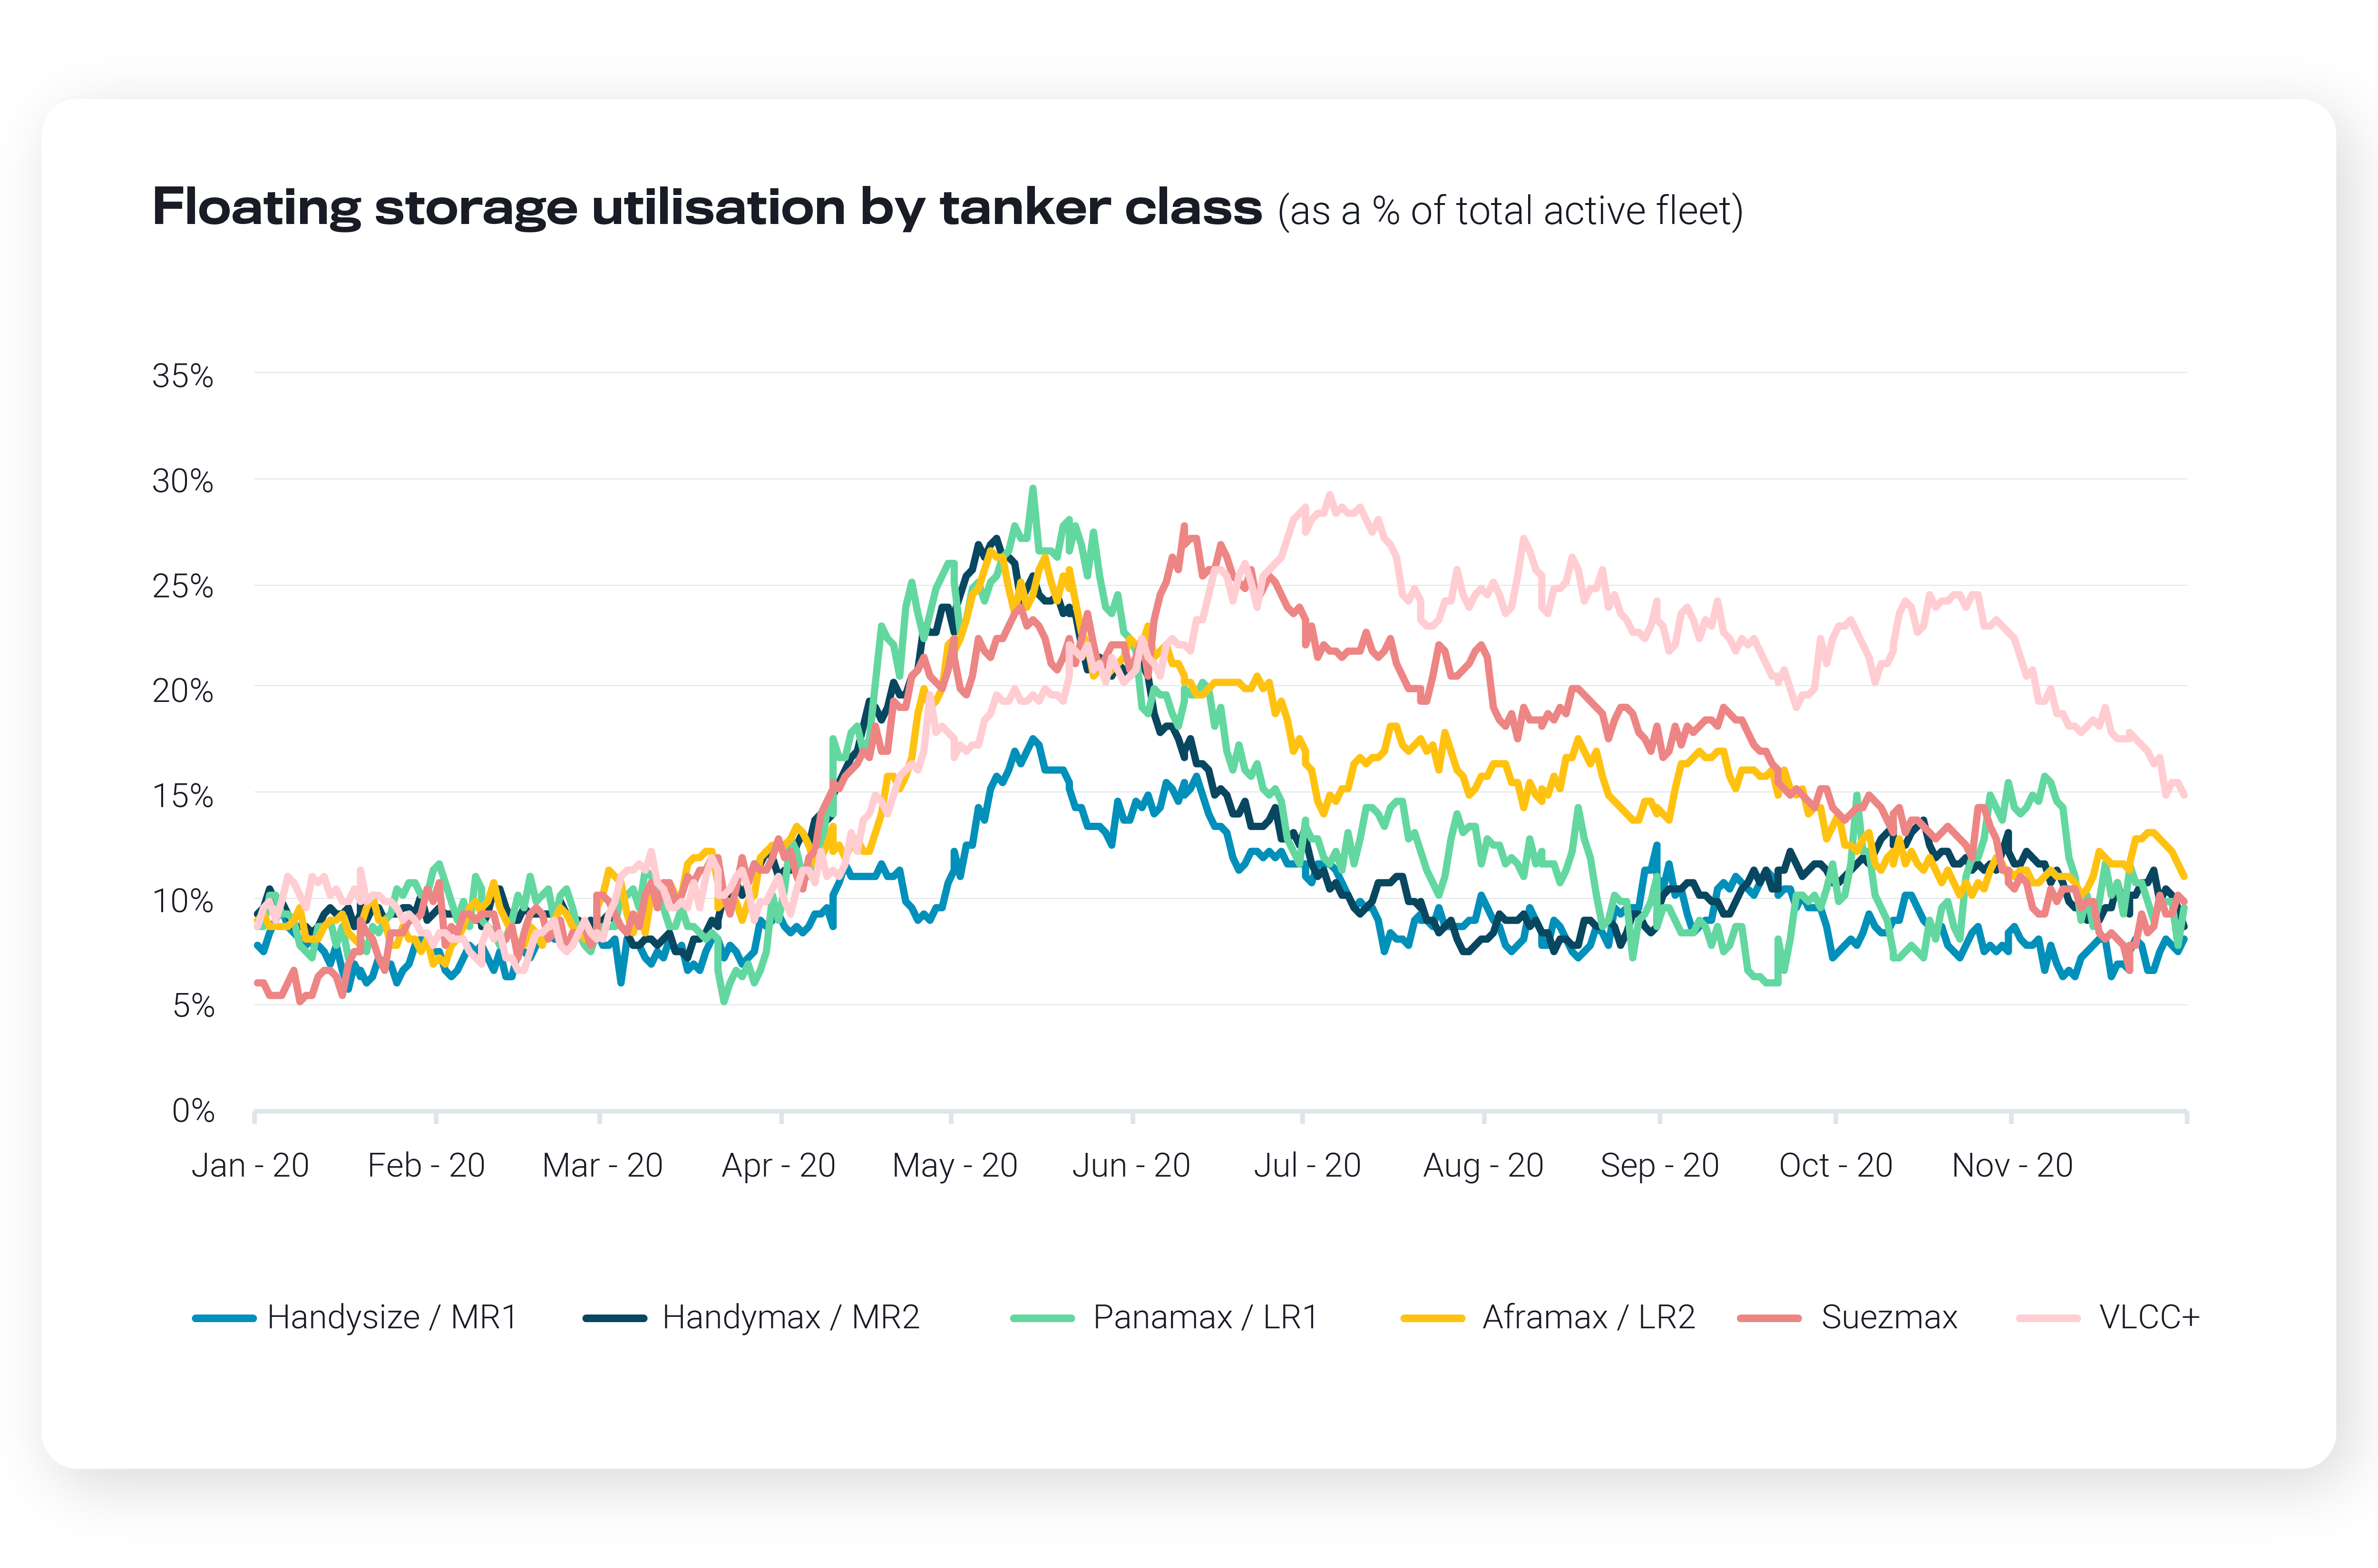
The impact of floating storage was felt unevenly across tanker classes when looking at the full year, becoming even more evident when splitting utilisation across Handysize to VLCC tankers. From May 2020 onwards, tankers were gradually returned into the spot market with the notable exception of VLCCs for two reasons:
i) The sheer economies of scale offered by deploying VLCCs, rather than other tanker classes, in floating storage
ii) Congestion delays off Chinese ports locked up a high percentage of the VLCC fleet
As of year-end, floating storage utlisation across tanker classes has largely reverted to pre-pandemic levels (pre-March 2020) bar VLCCs and LR2s – i.e. the largest tanker sizes typically used for crude and products transportation, respectively.
Review the year in Floating Storage – Vortexa Analysis
2020 Vortexa Special Reports feat. Floating Storage
- LATEST – November: Top Middle Distillate Trends
- September: Asia’s top trends: Diverging oil flows
- August: Top 10 Freight Market Trends
- July: Top 7 Floating Storage Trends
- May: The Great Scramble for Refined Products Floating Storage
- April: How much excess crude supply can floating storage absorb?
2020 Vortexa Blogs feat. Floating Storage
- October 7: ‘Catch 22′ for crude tanker markets
- September 16: Diesel floating storage: A second wave?
- September 4: CPP floating storage: Taking stock
- August 26: All eyes remain on floating storage for tanker markets
- August 20: VLCC utilisation falls to yearly lows
- August 20: What’s driving the Singapore fuel oil floating storage draw?
- June 17: Will fuel oil storage remain afloat?
- June 10: Spot tonnage rises as floating storage unwinds
- May 13: Russian diesel fills Swedish storage
- May 5: CPP Oversupply as Tankers Fill Up
- April 30: US crude waits in floating storage
- April 28: Crude in floating storage off PADD 5 builds
- April 22: Asia floating storage drives global build
- April 16: China’s oil exports sail to storage and long-haul markets
- April 1: Jet fuel floating offshore Malta
- April 1: 3 Reasons to Watch Floating Oil Storage Right Now
Want to know more about our leading floating storage indicators?
{{cta(‘bed45aa2-0068-4057-933e-3fac48417da3’)}}
