PADD 1 gasoline supply deficit widens in 2020 driving season
US gasoline supply deficit to PADD 1 widens in 2020 driving season
28 August, 2020
Gasoline markets in the US have been dominated by Covid-19-related demand destruction this driving season. Reduced waterborne gasoline imports and lower local refinery production have led to a large deficit in the total volume of gasoline supplied to PADD 1 during the driving season this year versus 2019.
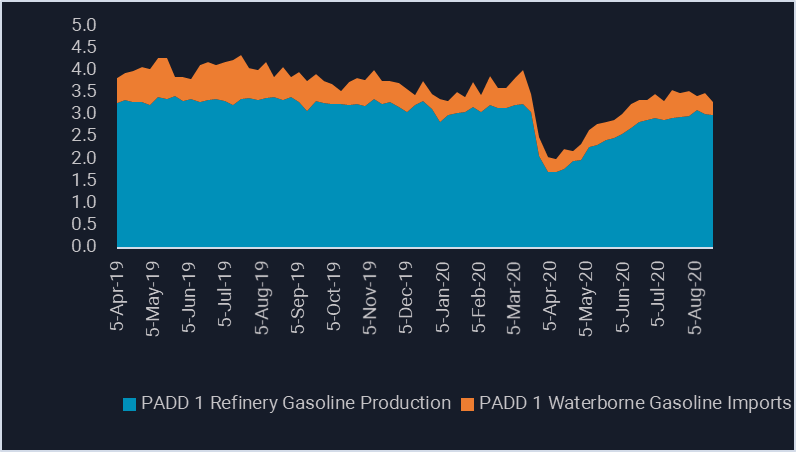
PADD 1 gasoline supply: Refinery production (EIA) & Vortexa waterborne imports (mn b/d)
- Waterborne gasoline imports into PADD 1 collapsed in April, shedding more than 450,000 b/d, or 82%, peak to trough within that month and slowly recovering to levels below those seen in 2019 (see chart above). The share of PADD 1 gasoline supply coming from waterborne imports remained remarkably steady in the 15-20% range throughout the ongoing demand shock.
- PADD 1 refinery production of gasoline also fell precipitously in April, according to US EIA data, falling as low as 1.5mn b/d (52%) lower, year on year. Gasoline production in the region has since recovered, reaching around 3mn b/d by August, but still below 2019 levels.
- Cuts to both waterborne imports and local refinery production has curbed the total amount of gasoline supplied to PADD 1.
- According to Vortexa data, there have been 44 million fewer waterborne barrels of gasoline delivered to PADD 1 than in 2019. This number pales in comparison to the 200 million fewer barrels of gasoline produced by PADD 1 refineries in the 2020 driving season – which runs from Memorial Day to Labor Day – compared to 2019.
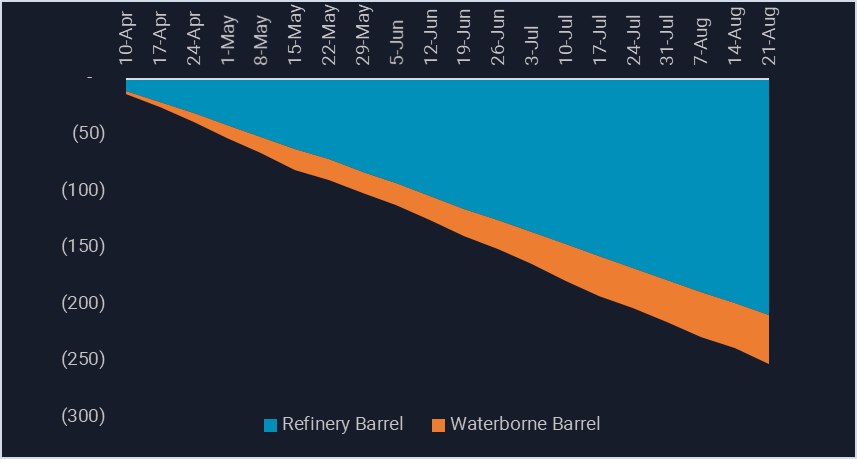
PADD 1 year-on-year gasoline deficit by source (mn bbl)
- PADD 1 saw a 44% reduction in gasoline barrels supplied during the 2020 driving season – comprised of local refinery production plus waterborne imports. This implies a total year-on-year gasoline supply deficit of more than 250mn bbl (see chart above).
Want to know more about these flows?
Watch our US Gasoline Trends webinar hosted by Vortexa analysts on 27 August
{{cta(‘1155877c-22f3-4570-beff-49eb9f73f8e2′,’justifycenter’)}}


