US LPG exports to Asia fall after holding steady
Vortexa Snapshot: US LPG exports to Asia fall after holding steady
23 June, 2020
The share of US LPG exports heading to Asia rose in the first half of the year, offsetting a drop in transatlantic flows. But eastbound cargoes slowed in June on the back of a collapse in arbitrage economics. Looking ahead, the momentum of US exports to China in particular will hinge upon the competitiveness against rival Middle East producers.
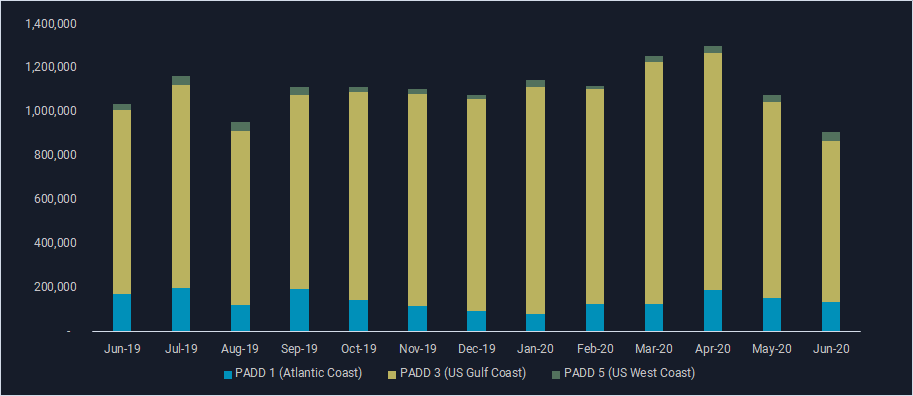
US LPG exports by PADD (b/d)
US LPG in Q2 – Rising share in the east
- US LPG exports have held strong throughout the Covid-19 related global slowdown, even registering an annual high of 1.3 mn b/d in April 2020, according to Vortexa data. They have relented in May and June, in line with seasonal expectations.
- The vast majority of US LPG exports, nearly 85%, load out of PADD 3, averaging 950,000 b/d between June 2019 and May 2020 (see chart above).
- PADD 3 LPG exports to transatlantic destinations – such as north west Europe, and the Mediterranean – declined sequentially each month between February and May 2020 while volumes to the East rose.
- Increased flows eastwards came on the back of positive arbitrage economics in the early part of 2020. But that has since disappeared, leading to the lower PADD 3 LPG exports observed so far in June.
- Nearly 90%, or 470,000 b/d, of PADD 3 LPG exports to the East of Suez markets headed to the Far East region within Asia over the past year.
- Notably, the return of LPG from the US Gulf coast to China buoyed flows to East Asia through May, after a period of almost zero LPG arrivals (butane, propane only) into China between 2H 2019 and March this year.
China draws more from US
- A rise in Chinese LPG buying interest was observed after Beijing waived the 25% import tariffs on US LPG from March, levelling tariffs with other rival Middle East suppliers.
- China imported a total of 840,000 b/d of LPG and associated products (including ethane, olefins/other chemicals) in May, the highest in at least four years. Imports in June are estimated at provisional 715,000 b/d, although this number may grow as more cargoes declare final destinations.
- Given the stronger outflow of US LPG to China – the US would top the list of LPG suppliers to China for the third consecutive month in June, displacing rival producers Qatar and UAE.
- The US offers a source of diversification and increased competition against Middle East suppliers. The majority of US LPG cargoes are loaded in Houston through the Panama Canal with a 30-day delivery time, compared to 21 days from the Middle East.
- Amid the recent narrowing of the arbitrage east, the momentum of US LPG exports to China will be dictated by its competitiveness against rival Middle East producers.

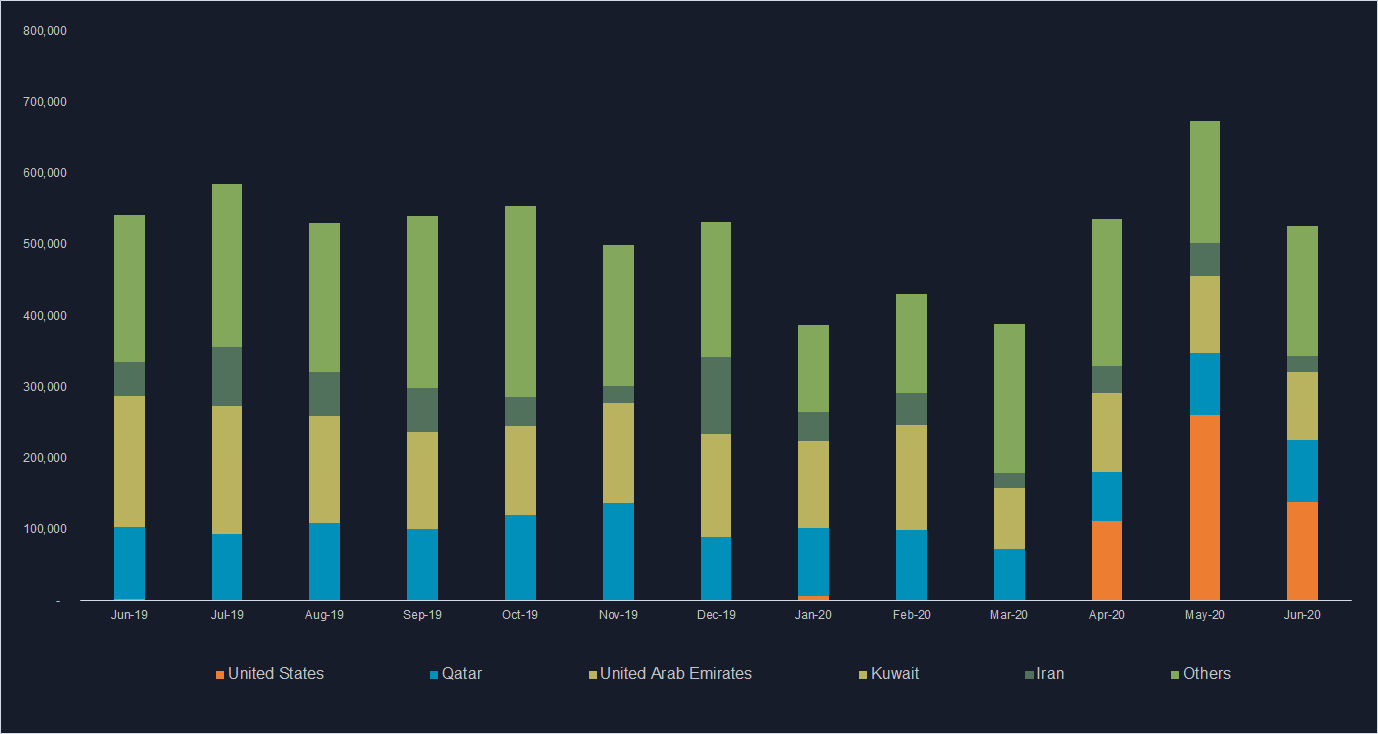
China LPG imports by origin (b/d)
Interested in a more detailed view of these flows?
{{cta(‘bed45aa2-0068-4057-933e-3fac48417da3′,’justifycenter’)}}


