US PADD I Gasoline Imports Showing Signs of Life?
Vortexa Snapshot: US PADD I Gasoline Imports Showing Signs of Life?
Gasoline imports into the US Atlantic coast (PADD I) have been rising in recent weeks suggesting early signs of demand recovery in the region. But on a year-on-year basis, imports are still well below levels seen a year earlier, underlining the massive demand destruction from the covid-19 pandemic.
Monthly recovery contrasts to last year
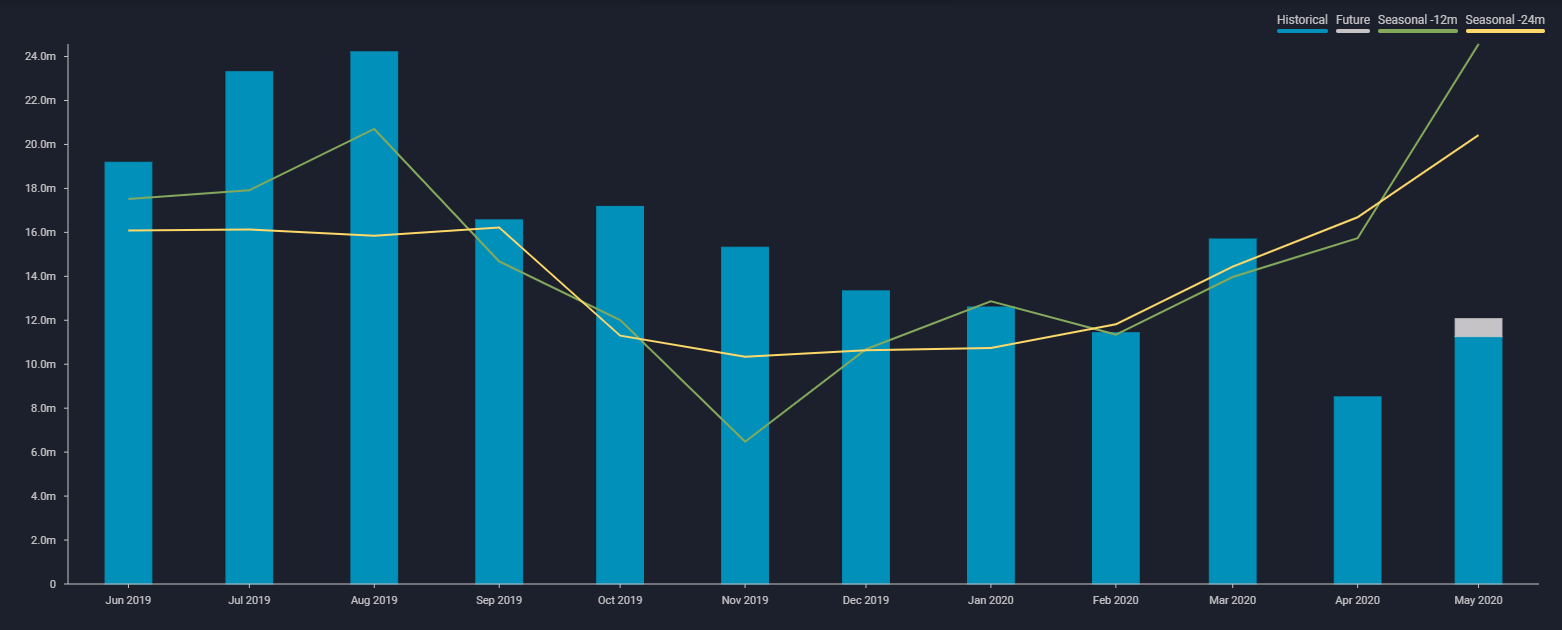
- PADD 1 gasoline/blending components imports have rebounded in May, registering around 12mn bbl, according to Vortexa data, up from the 17-month low of 8.5mn bbl observed in April 2020 at the height of covid-19 related transport restrictions.
- But despite the recent jump, full-month imports for May are still on track to have almost halved, year-on year (see chart above).
- May is traditionally a strong month for gasoline imports into PADD I as stocks build in preparation for the upcoming driving season. But the inventory build this year could be much more muted given the massive scale of demand destruction.

Vortexa Monthly PADD 1 Gasoline imports (bbl)
Weekly import rise vs. lower annual demand profile
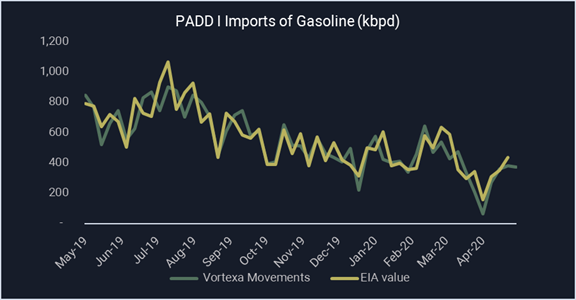
- Looking at weekly EIA data alongside Vortexa data, both datasets show weekly imports rising for past three consecutive weeks. PADD I gasoline imports rose by 280,000 b/d in the week ending 15 May, according to EIA data while Vortexa data over the same period posted a 320,000 b/d increase.
- The juxtaposition of higher imports volumes being much higher on the week, yet sharply lower year-on-year may suggest refiners are capable of, and expecting, a lower gasoline demand profile this year.
- Lower imports, on a year-on-year basis, will also be driven by already ample supplies in the region. PADD 1 gasoline stocks climbed have remained above 70mn bl since early April, according to the EIA, compared with a range of 60-63mn bl seen during April-May 2019.

Interested in a more detailed view of these flows and supply shifts?
{{cta(‘bed45aa2-0068-4057-933e-3fac48417da3′,’justifycenter’)}}