Illustrations of naphtha and gasoline strength
Vortexa uses flows data to illustrates how strong gasoline demand combined with steep petrochemical demand feedstock is driving up the demand for naphtha, making refiners max light end yields at the expense of middle distillate.
As we witness global naphtha cracks hitting highs since March, we can see that seaborne naphtha imports have had a stellar recovery so far this year, already hitting 3.41 mn b/d in May on a kbd basis and are expected to continue strong in July. Reduced arrivals in June have likely contributed to the current price rally.
Global naphtha arrivals by destination region (mn b/d)
Strong prices driven by petchem demand in Asia and gasoline blending in Europe have incentivised global refiners to make naphtha at the expense of poorly performing transportation fuels, mainly jet and diesel which have seen little to no recovery outside of the US due to continued travel restrictions. When combining seaborne jet and naphtha imports, we can clearly see how the share of the latter is steadily increasing; an indication of refineries working hard to minimise production of jet and make more naphtha.
Naphtha and Jet seaborne arrivals as a percentage total
As reforming margins stay strong in tandem with surging Atlantic Basin gasoline demand and European refiners return from maintenance, we see heavy naphtha grades head toward the reformers in Northwest Europe for blending into gasoline.
Heavy naphtha imports to Northwest Europe (kbd)
The supply story
Although we have seen a decline in seaborne naphtha exports from Qatar, other countries such as Russia, UAE, US, Algeria and India have responded to the pricing strength by increasing exports, more than making up for Qatari lost volumes.
Naphtha loadings from six major naphtha exporters (mn b/d)
And even as PADD 1 gasoline stocks are on the rise, we see global gasoline margins push higher alongside prolonged demand from the main Atlantic Basin hot spots which will only continue to pull naphtha into gasoline blending hubs.
Gasoline/blending component imports into the Atlantic Basin (mn b/d)
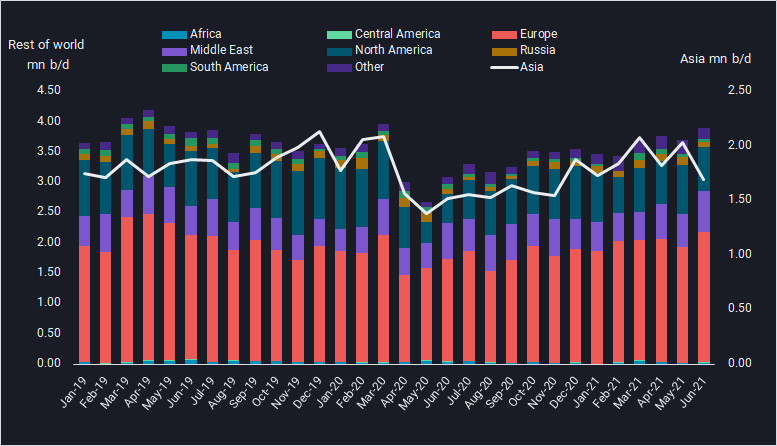
One contributing factor to the strength in gasoline cracks is the lack of supplies from Asia. Even with the US driving season well underway, the latest crack signals cannot be ignored and would expect any refiner to continue to respond with higher gasoline production.

Gasoline/blending component exports from Asia versus rest of world (mn b/d)
As the battle for the barrels continues, we see solid room for gasoline strength beyond peak driving season. These forces combined with strong petchem demand and short supply of alternative LPG as feedstocks will likely translate to increased tightness in the naphtha complex and can only lead refiners to maximise light yields at the expense of middle distillates.
More from Vortexa Analysis
- Jul 01, 2021 Q2 2021 Freight market update
- Jun 29, 2021 Two truths – why OPEC+ is hesitant
- Jun 24, 2021 Surging diesel flows – a push or a pull
- Jun 23, 2021 $100 barrel of crude boon or bust for tanker markets
- Jun 18, 2021 Crude markets diverging in Atlantic Basin
- Jun 16, 2021 Question marks for freight rates in a largely supportive global LNG picture
- Jun 15, 2021 China’s independent refiners maneuver new diluted bitumen tax
- Jun 10, 2021 Transatlantic gasoline flows are here to stay
- Jun 7, 2021 Role reversal? West of Suez in the driving seat
- Jun 4, 2021 North American LPG shipments to Asia face pressure
- June 2, 2021 China’s new consumption tax turns tide of gasoline and diesel exports
- Jun 2, 2021 Suezmax tankers infiltrate Europe-bound transatlantic crude flows