How much further will global crude inventories fall?
Global crude inventories are at one of the lowest levels historically after a significant draw last year. Will this trend continue or is an inflection coming?
Global crude stocks in floating-roof tanks have been in strong decline ever since June 2021, after receding more moderately from a Covid-induced peak in July 2020. Storage tank utilisation has fallen by nearly 10pp from peak to trough, raising the question of how much further stocks can realistically be drawn. This blog will highlight recent developments and illustrate how much additional light Vortexa onshore inventories data sheds on the crude oil market.
Global crude inventories fell at a rate of 1.3mbd from mid June 2021 to the end of the year. That is three times the speed of the drawdown over the previous twelve months which was 430kbd. Global tank utilisation peaked at 65% in July 2020 and reached a low point of 55.7% in the first week of January this year. Since then, we have observed an average stockbuild of 0.6mbd over the last four weeks ending 3 February.
China going against or setting a new trend?
The key driver of the change in direction was China, building at a rate of nearly 1mbd over the last four weeks. Easing crude prices in November, new import quotas for crude at the start of the year, limitations on refining operations (“blue skies” ahead of the Olympic Games), and potentially increased concerns about supply security may have been contributing factors.
But China was by far not the only country seeing builds at the start of the new year. On a 4-week average basis, another twelve countries added at least 50kbd individually or 1.1mbd jointly (in falling order South Korea, Spain, Singapore, Algeria, France, Ecuador, Taiwan, United Arab Emirates, Israel, Iraq, Romania, Indonesia). And 56 more countries saw stocks building over the last four weeks by a combined 0.8mbd.
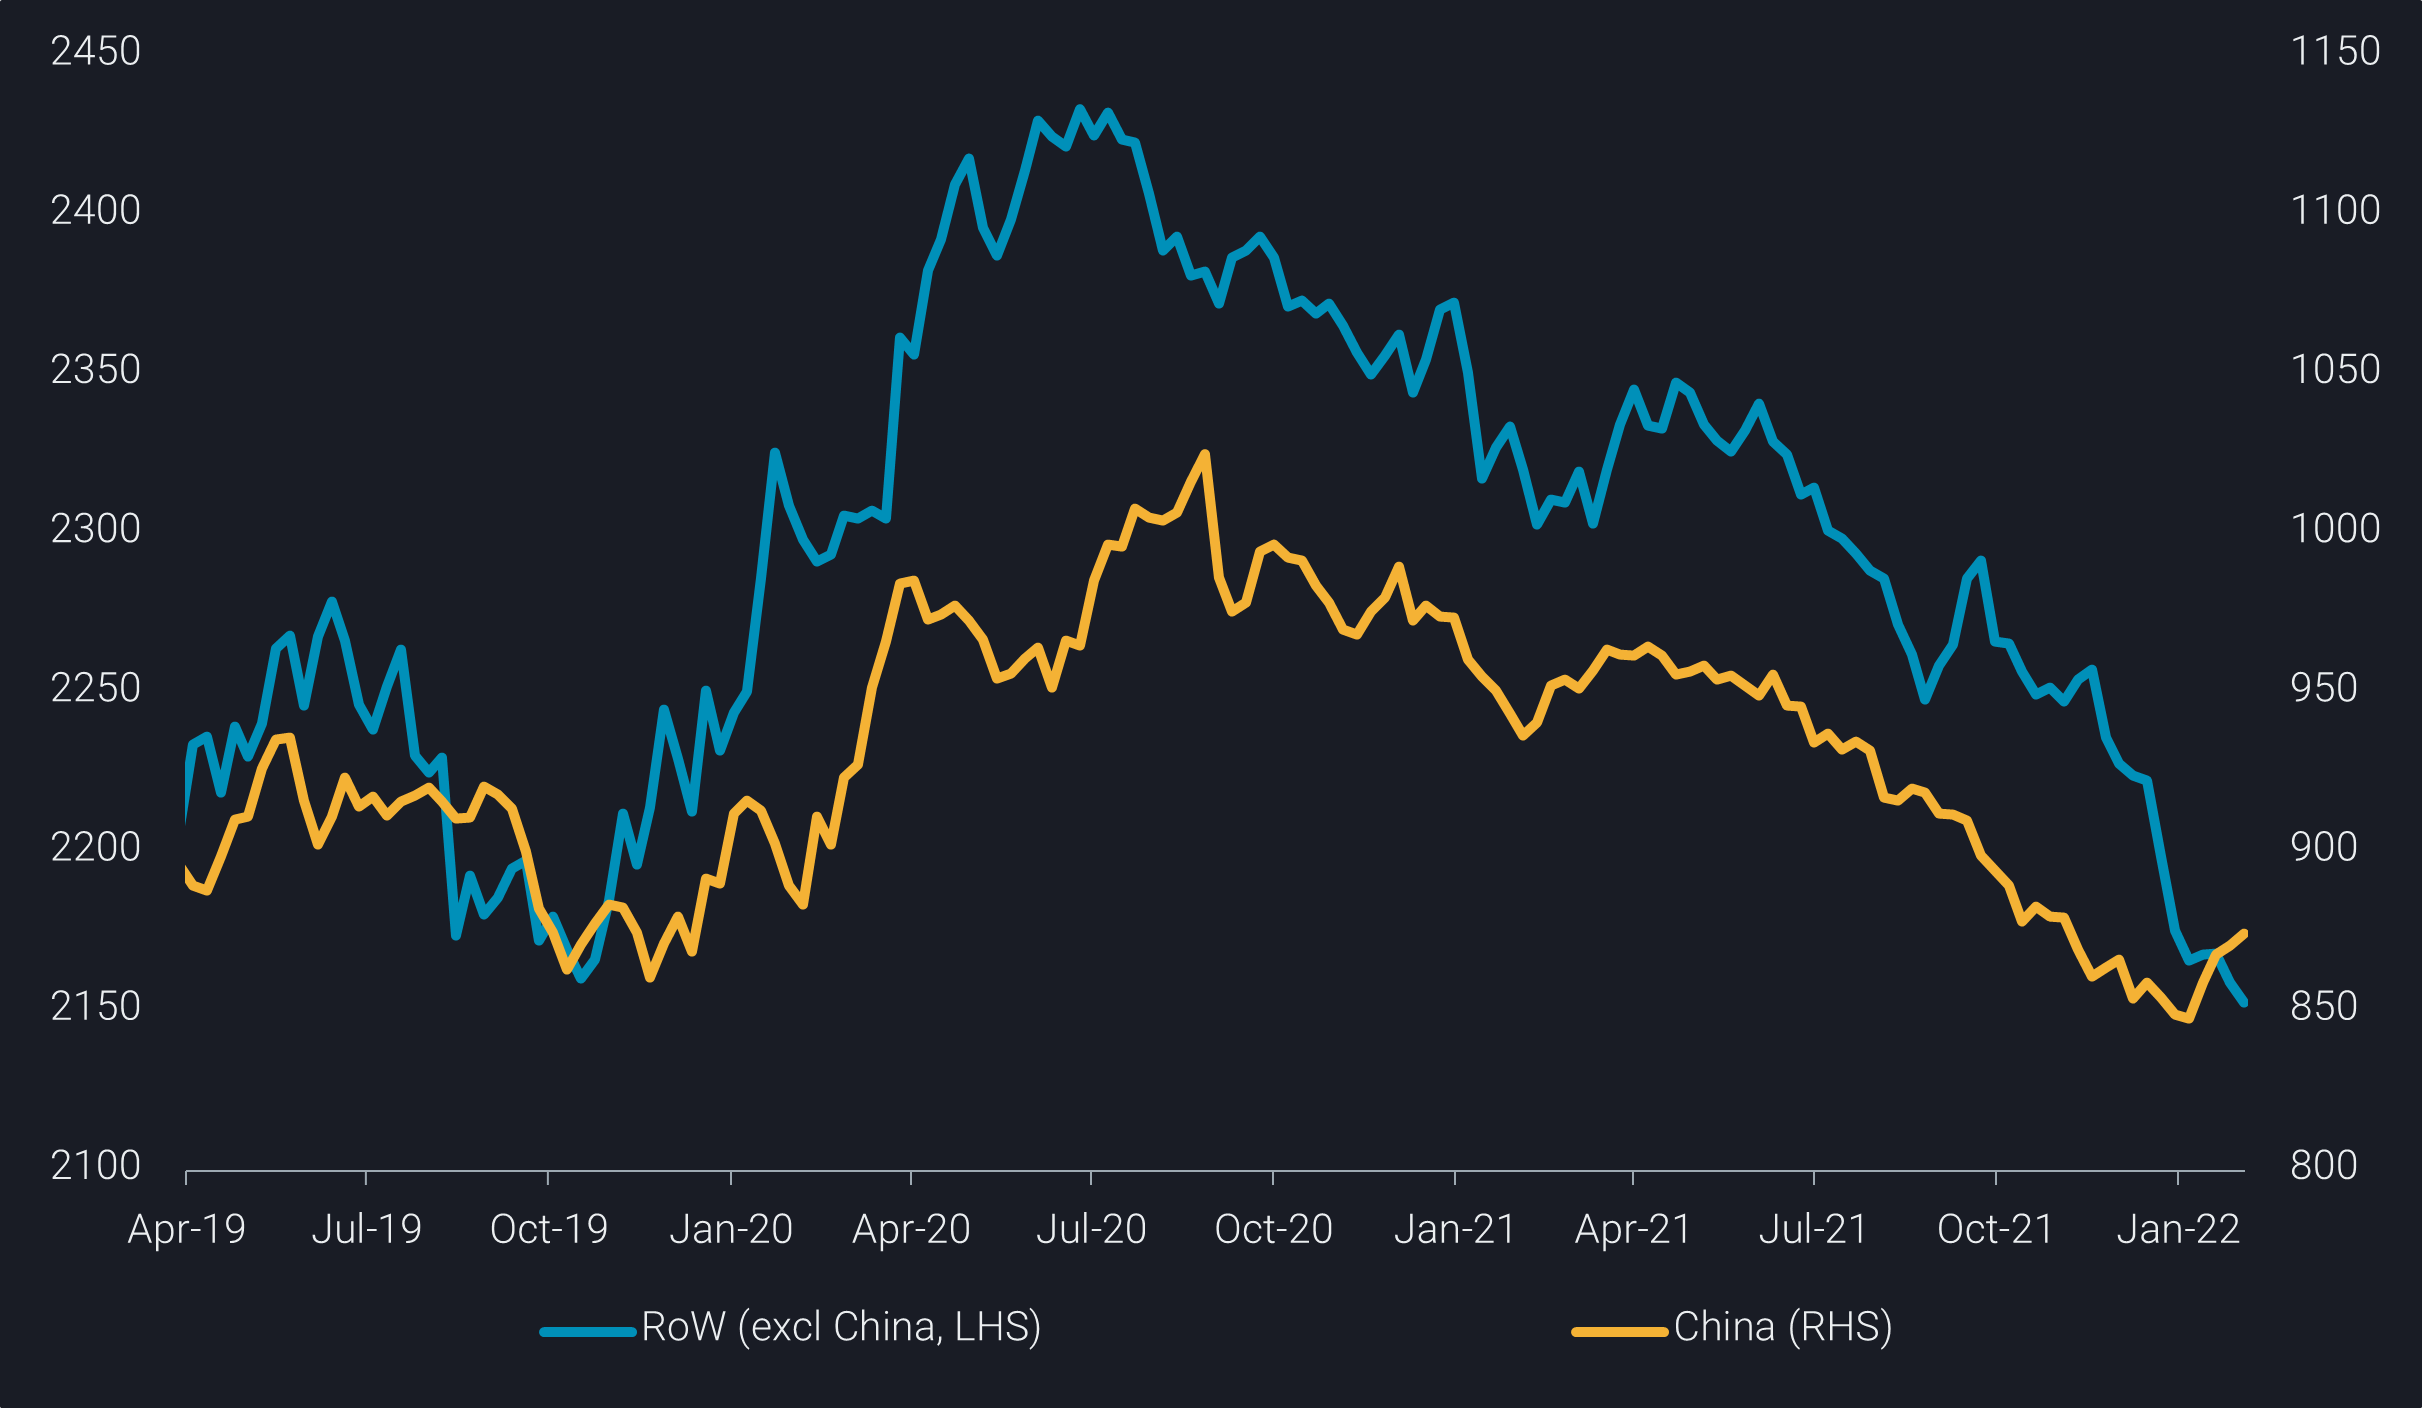
Onshore floating-roof inventories split into China (RHS) and Rest of World (RHS) (mb)
The first chart illustrates that China has generally shown quite similar stock change patterns as the rest of the world. Apart from the above-mentioned specific reasons for the recent Chinese stockbuilds, seasonal factors may also be at play, with tax reasons pushing for destocking ahead of year end in some markets. Globally, we have observed massive draws of 4.1mbd in the last two weeks of 2021. If these stockdraws are barrels that have been exported, they will evidently need some time to show up again in tanks.
Stockdraws most pronounced in trading and consumption hubs
Backwardation has staged a comeback on the global crude market in early 2021, but the first big rise occurred in June, followed by further leaps in October and then more recently, the last couple of weeks. The acceleration in stockdraws since June last year was much more pronounced in the main trading/ consumption areas, as illustrated in the chart below. North & Central Atlantic America lost 12% of its crude stocks over the last seven months, followed by 10% in the wider Northwest European market, and 8% each in Northeast and Southeast Asia. Other markets, like the wider Mediterranean (incl. Black Sea and Caspian), the wider Arabian Sea, the South Atlantic or West Coast America saw stocks drawing by only 1% to 5%. Most of these markets are dominated by crude suppliers, and further stockdraws seem unlikely.
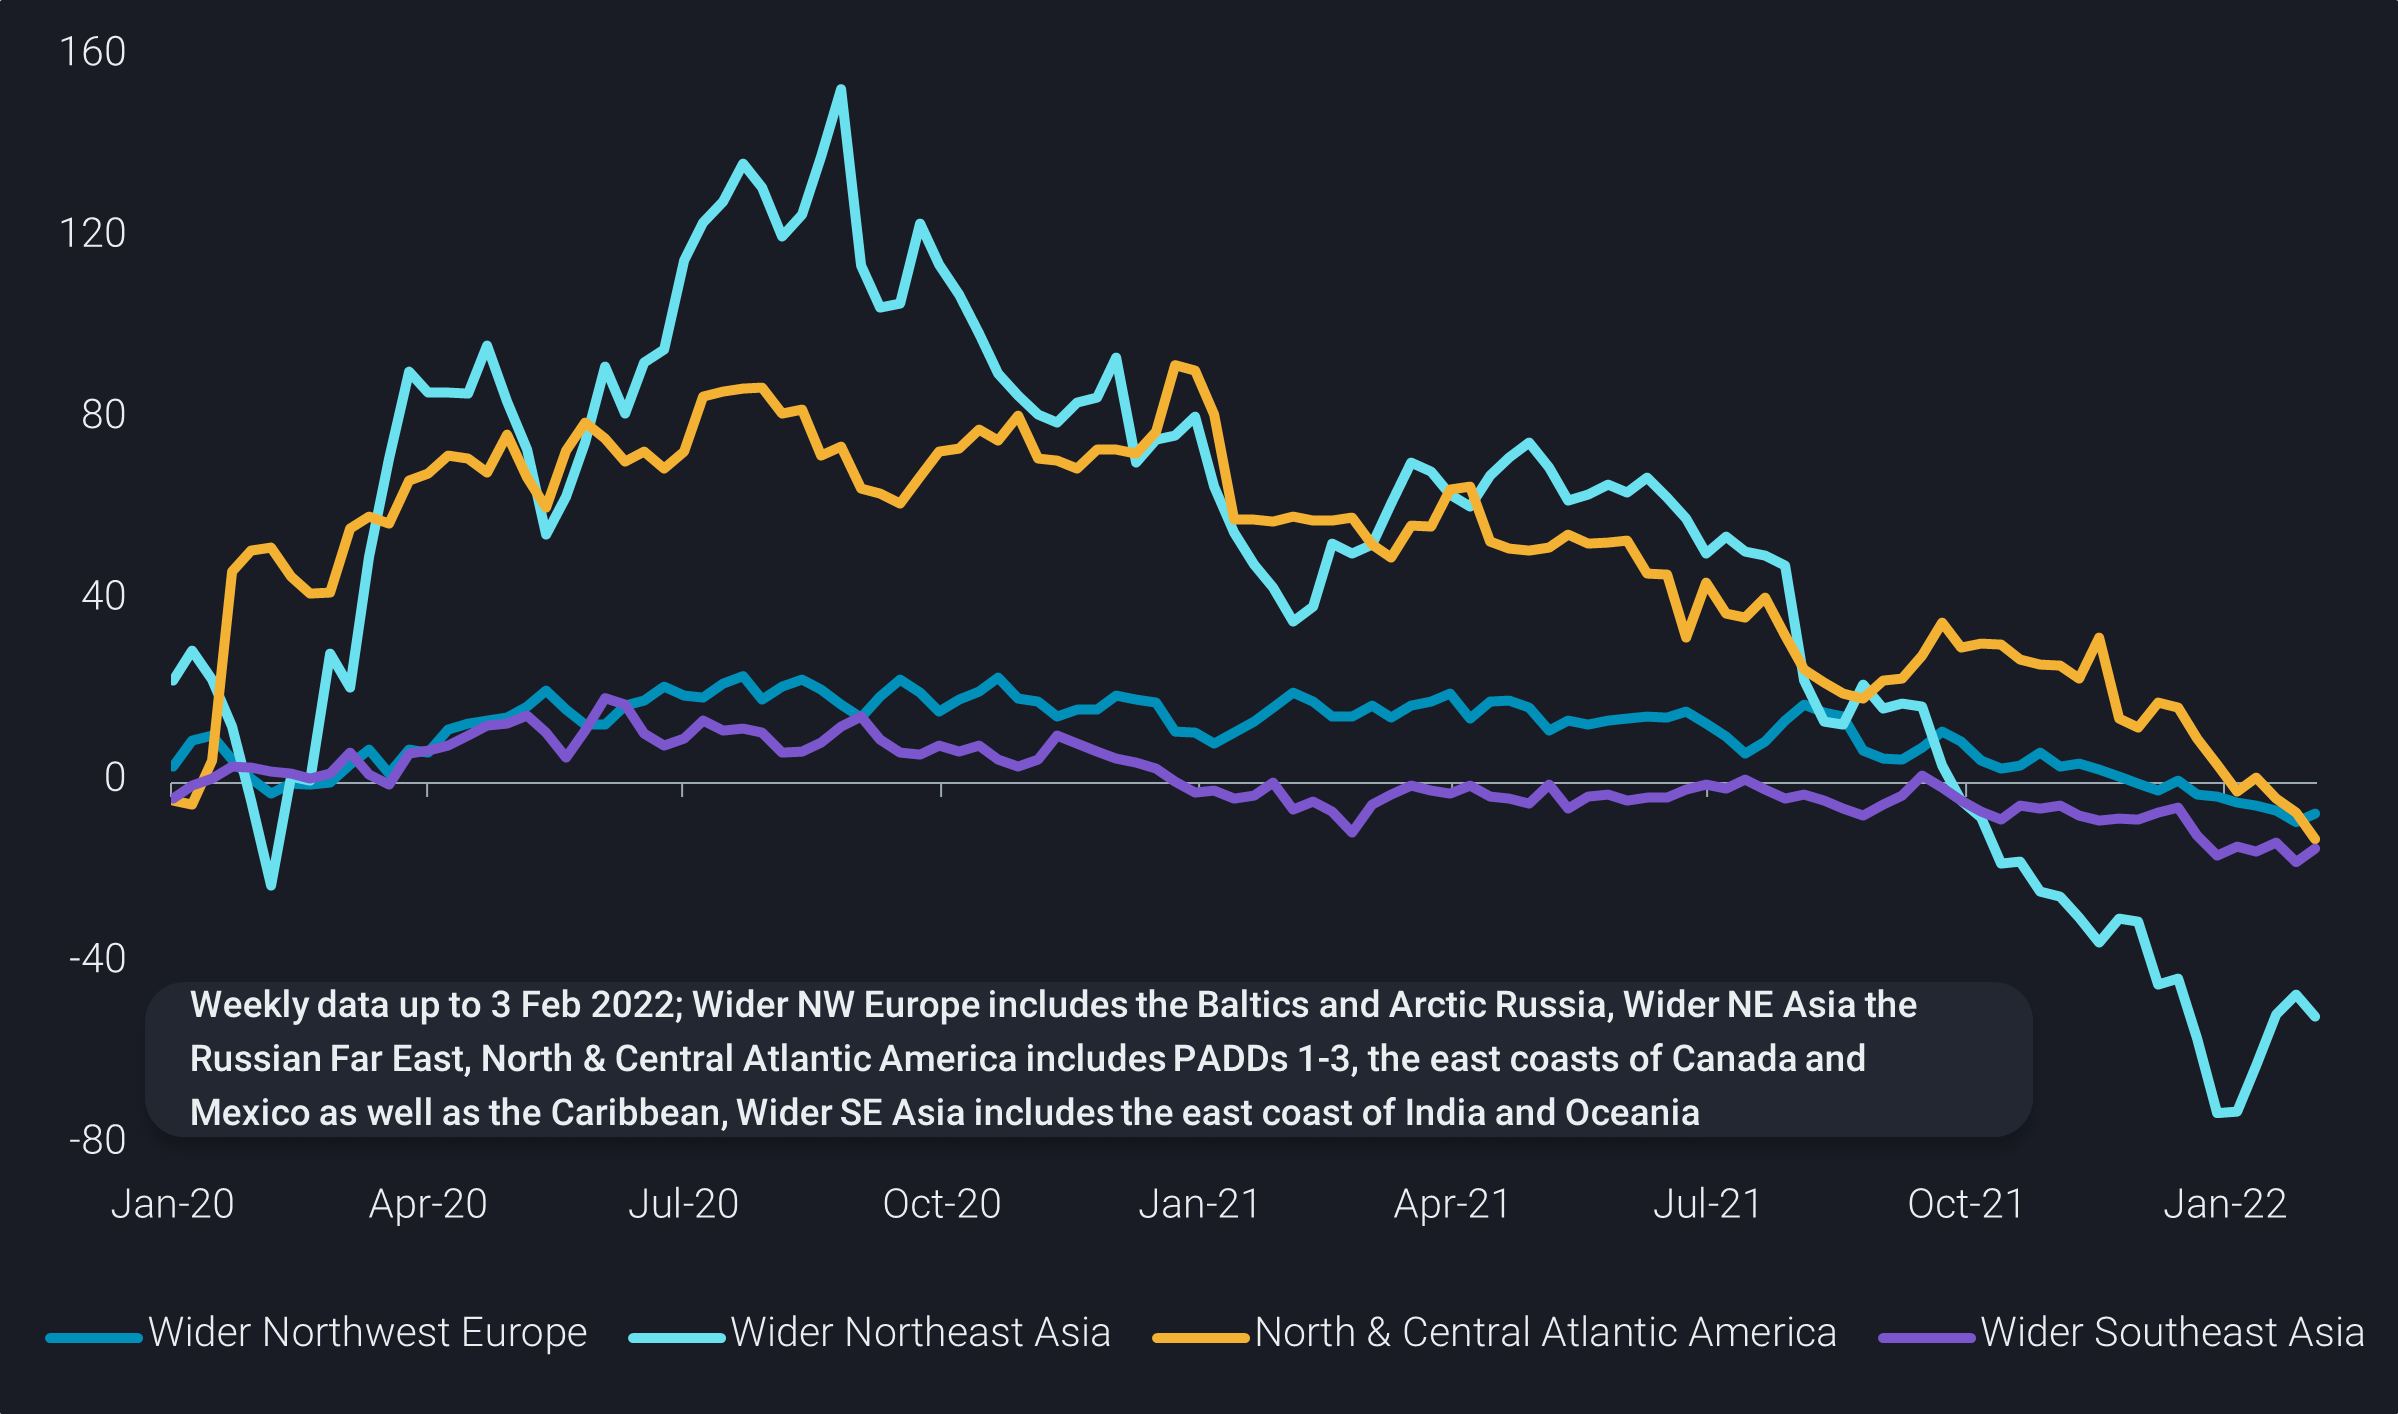
Cumulative crude inventory changes vs end 2019 by selected regions (mb)
While Northeast and Southeast Asia have already shown a recovery or a stagnation in inventory patterns over recent weeks, the wider Northwest European region has seen the first build in eight weeks last week. Based on JODI data for the last 20 years, there should not be much more leeway for lower stocks, perhaps at a maximum some 15mb. And it is questionable whether the part of North & Central America feeding into the Atlantic Basin can continue the steep draws of recent weeks and months, especially given that US stocks are at the lower end of the historical range. At any rate, the EIA projects a 40mb build for the US over the Feb-Apr timespan, putting a swift end to recent draws. In general, it can be questioned whether any further increase in backwardation can trigger additional stockdraws that have failed to materialise based on already strong incentives over past months.
Vortexa covers mores stocks in opaque markets than in the well-reported ones
Vortexa’s onshore crude inventory data allows tracking of stock changes up to the week ending last Thursday for more than 20,000 floating-roof tanks globally spread across 112 countries. This means that our coverage is actually bigger in markets outside those regularly and reliably covered by JODI data. This freely available source, backed by APEC, Eurostat, IEA, OLADE, OPEC and the UNSD, currently provides complete and consistent data up to November 2021 for 39 countries (our data for those countries is shown in dark blue in the chart below). Data for another 13 countries is available for 2021 but incomplete (our data for these countries in yellow). 60 further countries were not covered at all in 2021 by JODI, making up more than 50% of our data.
.png)
Onshore floating-roof inventories by coverage in JODI data (mb)
One reason for this potentially surprising finding is that Vortexa data is limited to floating-roof tanks (except for Cushing where infra-red technology is used additionally). That means underground storage is not included – the driving force behind our coverage being 1,100mb lower for the following ten countries, when compared to official data as reported by JODI: Canada, Germany, Hungary, Japan, Norway, Poland, South Korea, Sweden, Turkey, United States. However, this is mitigated by similar trends in floating roof and total storage, when looking at trends or average weekly changes. And the combined data is freely available from national entities (e.g. EIA, PAJ or with the usual 2-3-month delay from JODI).
Benchmarking: no gold standard for inventory data
In ship-tracking there are expectations for close correlations with official data, which is facilitated by observations being usually averaged out on a monthly basis, while data is collected with high vigour due to tax and duty obligations with multiple parties being involved (importing and exporting authorities, port authorities and agents, buying and selling companies etc).
For inventories, the situation is vastly different. It is not an average flow measure, but a reported value at a given point in time, in official data often the last day of the month. But even over the course of a single day, tank levels can vacillate drastically. Furthermore, authorities have a very limited interest in the actual level of storage, except perhaps for end-of-period evaluations, and the number of players involved is highly limited, especially for individual tanks. Different players will operate different tanks depending on where they sit on the supply chain. Reportings will be done via some form, often the responsibility of a single person with limited cross-checks. Little is known about the methodologies and actual procedures.
Even for OECD countries the benchmarking of data is a tricky endeavour. Let’s look at the case of the United Kingdom. The Department for Business, Energy & Industrial Strategy (BEIS) is providing month-end stocks for “Crude oil and refinery process oil”, currently including preliminary data for November. The data is split into four categories: 1) stocks at refineries, 2) terminals, 3) offshore and 4) primary net bilaterals. The last point should be the balance of stocks held on behalf of the UK in other countries and the reverse, but without giving outright levels. At the same time, the UK figures in JODI or IEA datasets do not match with BEIS data, albeit it appears to cover primarily refinery stocks and possibly some terminal stocks.
Vortexa data is higher than BEIS data, which itself is higher than JODI data. The final chart shows that Vortexa data for refinery stocks is a close match with the total JODI reading, while the gap between full Vortexa and JODI data is closely correlated to Vortexa commercial stock reading, which covers all the terminals related to crude export (Teesport, Sullom Voe, Flotta, Hound Point, Finnart).
.png)
UK crude inventories by type and in comparison to JODI/IEA (mb)
We suspect that many countries miss some data in their official reports to IEA/JODI (both sources usually provide the very same data). Such underreporting will include volumes stored at other terminals than linked to refining operations, volumes in transit to other countries, as well as volumes held on behalf of other countries as part of the IEA supply security policies.
All in all, Vortexa’s data offers wide-ranging advantages, including timeliness, completeness, coverage, and the fact that it is exclusively based on actual measurements rather than reportings or modelling. It complements our flows data and allows our clients to take a leap closer to real-time crude oil balances, facilitating valid deductions on supply and demand/refining operations on a location-by-location basis.
More from Vortexa Analysis
- Feb 8, 2022 How is Omicron impacting Asia’s oil demand so far?
- Feb 2, 2022 Can clean tanker markets benefit from surging diesel prices?
- Feb 1, 2022 Russian roulette being played out in Ukraine, leaving the gas market guessing
- Jan 27, 2022 Naphtha & LPG: Falling freight rates suggest flows will remain curtailed
- Jan 26, 2022 Reality check on Russian oil and gas sanctions
- Jan 25, 2022 China’s crude destocking pauses. Is it looking for a refill?
- Jan 20, 2022: Maiden Crude Tanker CPP Voyages: What happened and what to expect
- Jan 19, 2022: Oil price rally is driven by lack of supply right now
- Jan 18, 2022: Global diesel market pricing in tighter supplies ahead
- Jan 13, 2022: Omicron: pre-emptive supply cuts & resilient demand draw stocks and lift prices


