2021: The Freight Forecast
Explore freight markets forecast for 2021 based on Vortexa data.
Freight markets were upended more than once throughout 2020, in what is expected to be one of the most volatile years on record. Tankers registered record highs in floating storage demand and earnings, during approximately the first half of the year, before collapsing and reaching yearly-lows, only to stagnate at these levels as the year draws to a close. The reasons behind such volatility can be loosely simplified to firstly, an oversupply of cargoes in the market fuelling the rally at beginning of the year. Secondly, a collapse in oil demand, a result of global lockdowns amidst the ongoing pandemic, leading to the current tanker market woes.
As hopes of a widely available and rapidly distributed vaccine aim to provide much needed stimulus to a battered economic outlook, freight markets are eagerly awaiting a return to normalcy to lift earnings to healthier levels. Below we review the events of 2020, and seek to identify the main trends that will shape the 2021 freight markets. We assess whether its plain sailing ahead or whether we can expect some choppy waters.
-
Taking (offshore) stock of 2020
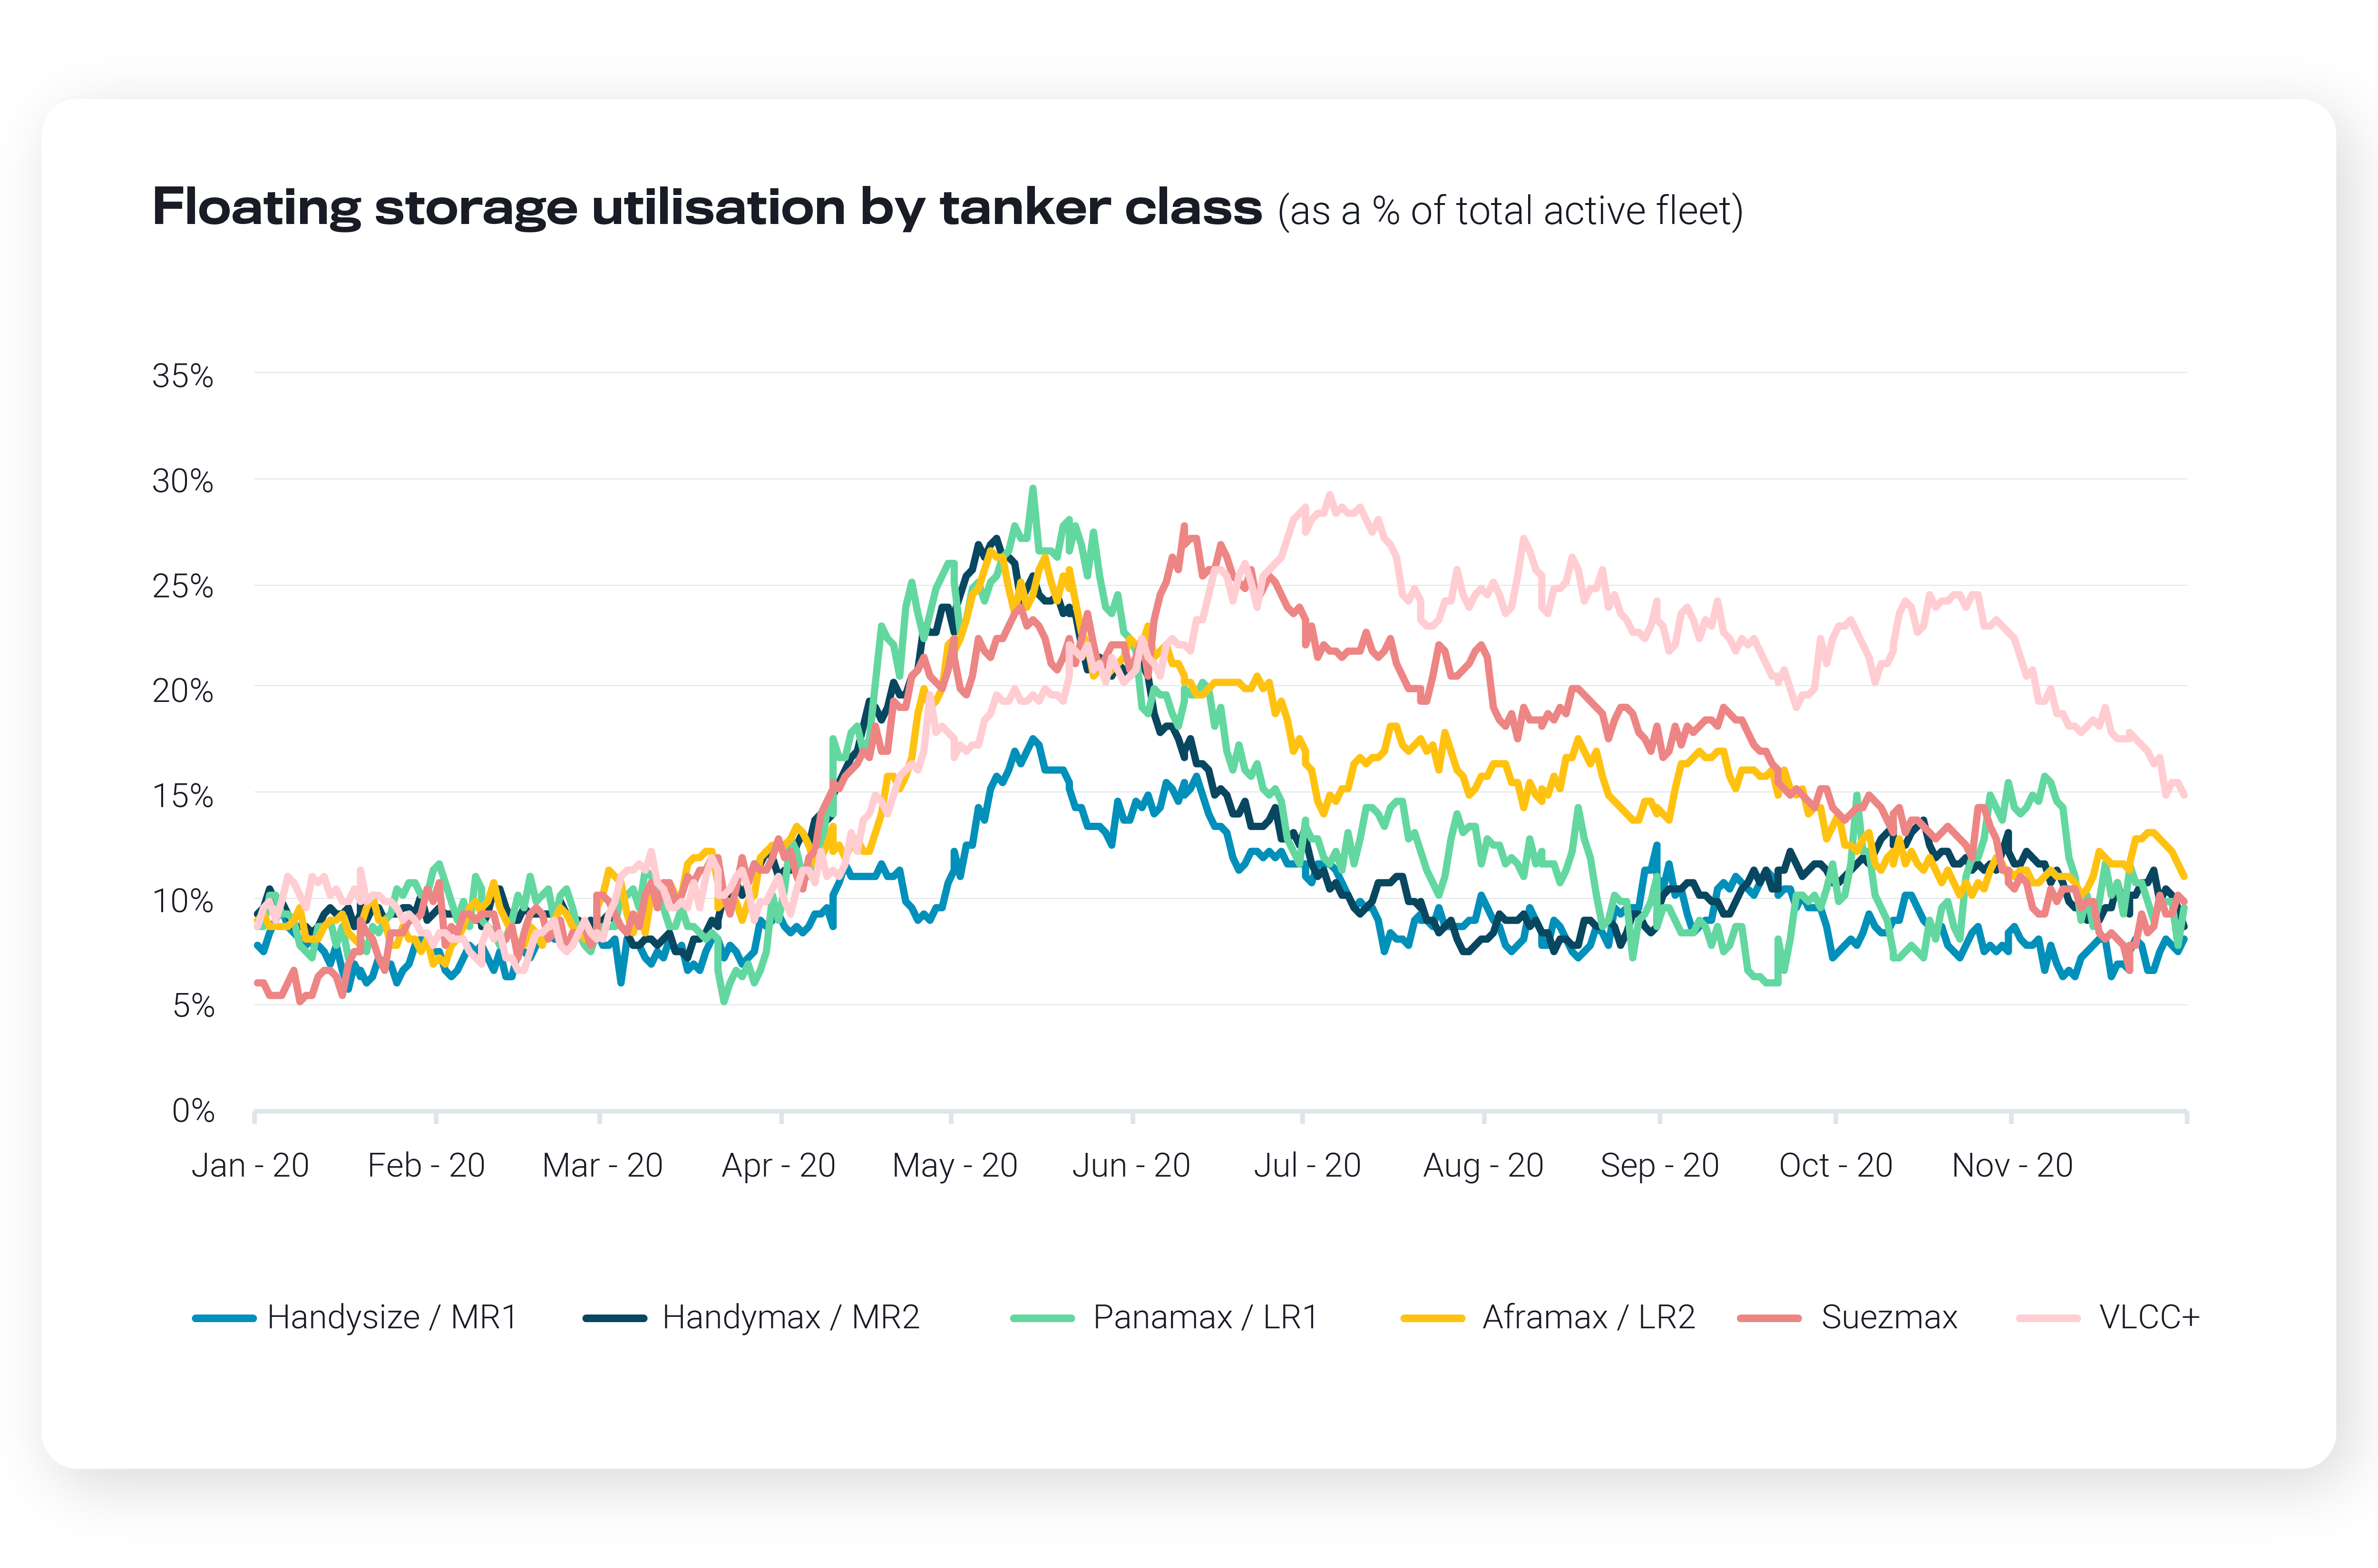
- The story of 2020 would not be the same without the rise and fall of floating storage and it’s impact on freight market dynamics. Global crude and condensate in floating storage peaked at a record daily rate of over 215 mn bbl at the end of June, a record reflected by higher tanker utilisation for this purpose. Whilst levels hovered at an average of 9% in Q1, the utilisation percentage rose to a yearly-high of 23% (across the entire fleet for tankers Handysize and above) in May.
- At its peak, almost one in every four tankers globally was deployed in floating storage, an all-time high according to Vortexa data. By end-November, utilisation in floating storage for the global tanker fleet had fallen to pre-pandemic levels as tankers were gradually released from floating storage duties after Q2. We expect floating storage to remain a balancing factor for freight markets in 2021 with persistent oversupply carried into the new year. This time round however, the lessons of 2020 will be fresh in the mind of market participants.

The ebb and flow of freight rates
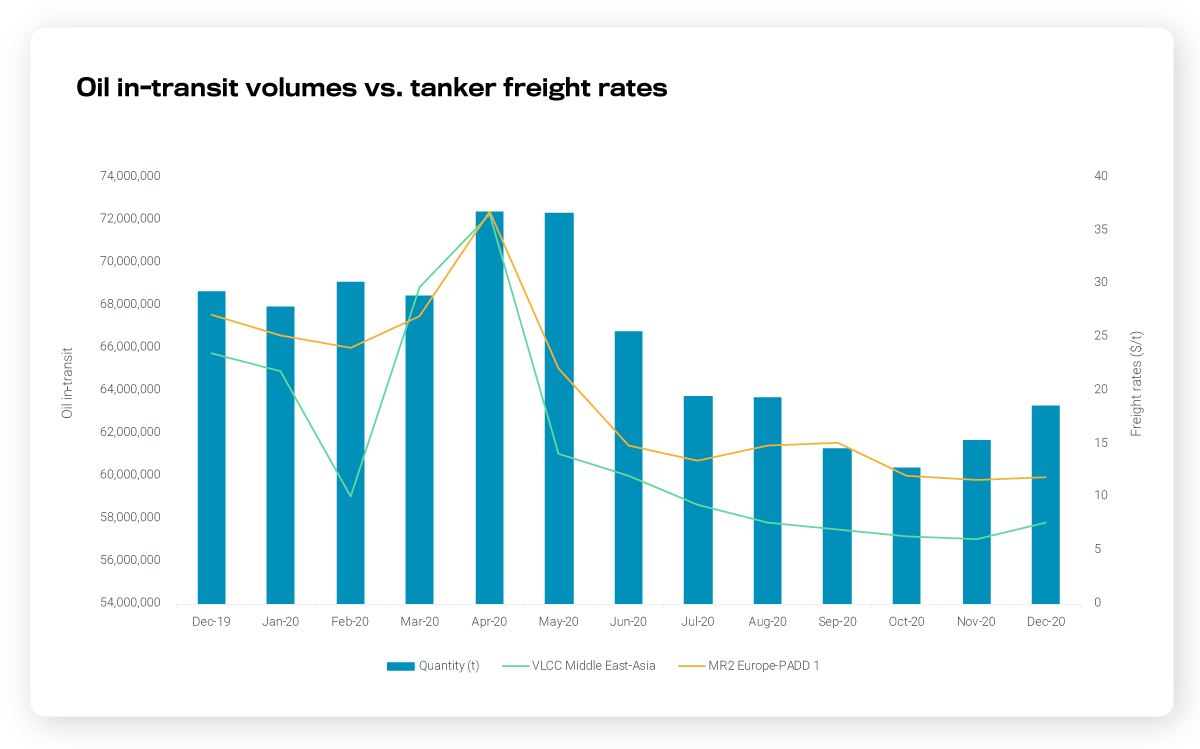
Oil in-transit volumes rose drastically in April 2020 when prices crashed, reaching a daily average year-high of 72.4 mn mt for crude, DPP and CPP cargoes combined. The oversupply of cargoes in the market buoyed clean and dirty freight rates, whether for floating storage purposes or for the tanker spot market, lifting tanker freight rates for both VLCC Middle East to Asia and MR2 Europe to PADD 1 to a peak of $37/t in the same month according to pricing data from Argus Media.
Fast forward to December 2020 and high earnings as well as high levels of in-transit volumes are but a thing of the past. Oil in-transit volumes fell 17% by October 2020 to reach a yearly-low daily average of 60.4 mn mt, compared to their yearly highs seen during April 2020. After bottoming out in October, volumes have only slightly rebounded to 63.3 mn mt (as of December) according to Vortexa data. As cargo availability in the market dried up following a collapse in demand globally, the withdrawal of offshore stocks from floating storage only served to increase vessel availability in the spot market. Freight rates (as seen in the graph below) followed suit, dropping an astounding 80% and 68% respectively since April 2020 to reach yearly-lows in December of this year. With demand still some way off from recovering we don’t expect oil in-transit volumes to go above 2020 levels in 2021.

Tanker demand: The sun will continue to rise in the East in 2021, large producers back online a balancing act
Tanker demand dynamics for 2021 will be largely dependent on whether buying of crude and in turn refinery outputs increase in the coming year. With 24.5% of global seaborne crude arrivals discharged in China in the past year, the China’s appetite for crude will remain the most important driving force in 2021 on which the fortunes of the shipping market will be largely dependent. We expect the return of Libyan oil fields as well as potential easing of sanctions on Iran and Venezuela to inundate the market with cargoes, providing support to crude and dirty tanker freight demand worldwide.
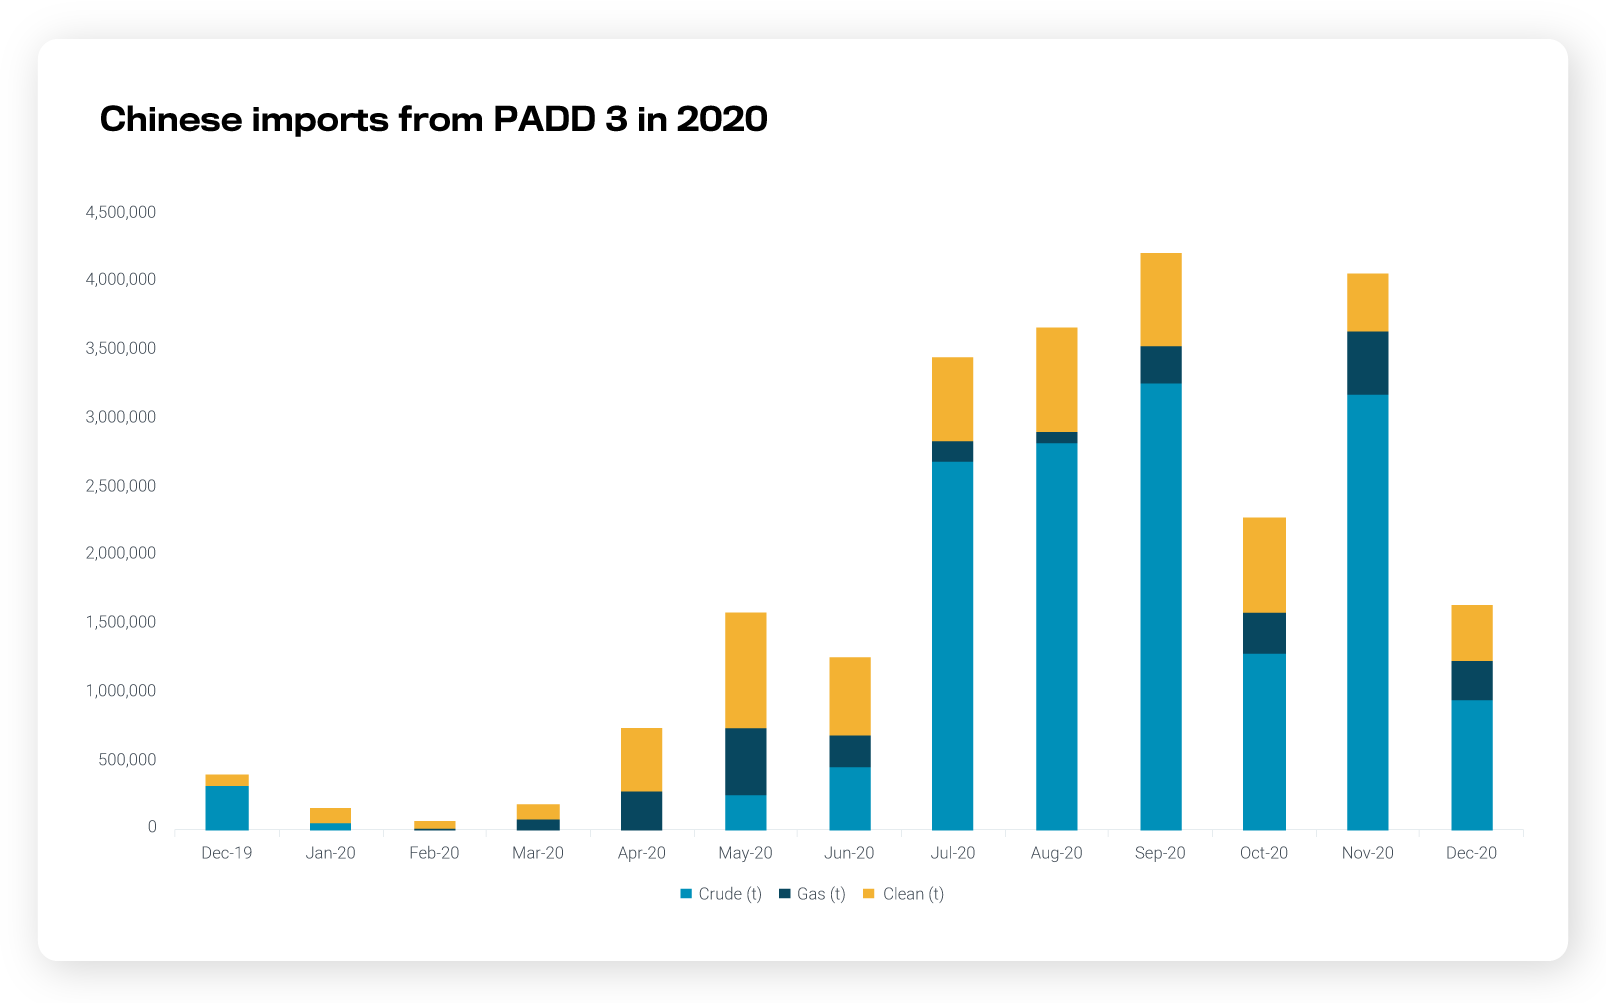
One key exporting market to watch will be the US Gulf Coast (PADD 3). Whilst previous commitments of Chinese energy buying has failed to materialise for the first 6 months of the year, a strong uptick in the second half of the year of crude, refined products and gas imports by China could provide welcome momentum into 2021. Whilst Chinese oil and gas imports from PADD 3 averaged 637,000 mt per month in the first half of 2020, these rose to 3.2 mn mt per month in the second half, with half of December to go, or a five-fold increase. Sino-American relationships might not necessarily improve under the next US presidency and it is uncertain that Europe would step in as buyer of US crude if Chinese imports falter. Though we expect China to remain the world’s largest importer of crude in 2021 we don’t expect this to be enough for freight rates to go above 2020 averages as it is unlikely US crude exports will increase (for more see our Top 10 Oil Trading Themes for 2021).

Tanker demand: CPP markets driven by refinery closures, outages
Whilst lockdowns worldwide, and more specifically in key middle distillates and light ends importing markets such as France and the US have negatively impacted CPP imports, we expect imports to rise, driving tanker demand, as restrictions ease. However, it is anyone’s guess how long this will take and the recovery will be uneven across regions. In the shorter term, the combination of ample onshore and offshore stocks, especially in the example of the French/northwest European diesel, may hinder any sustained increase in imports.
A bright spot for the tanker market could arise from the strengthening of the Australian CPP import market and subsequent boost to freight rates for clean tankers in the region. Driving this is BP’s Kwinana refinery closure next year and other Australian refineries contemplating a similar approach.
Globally, close to 1.7 million barrels/day of refinery capacities are planned to be shut between 2020 – 2021 according to the International Energy Agency. This translates to a double-edged sword as some markets will lose out on cargoes and keep a lid on freight rates but equally lead to an increase in CPP imports for others leading to an increase in tanker demand. We expect Europe and North America to bear the brunt of refinery closures with tanker rates to strengthen as ton-miles increase from higher imports of clean products from newly available refinery capacity from the Middle East and Asia.
Tanker supply: Regional availability levels point to a soft start to the year
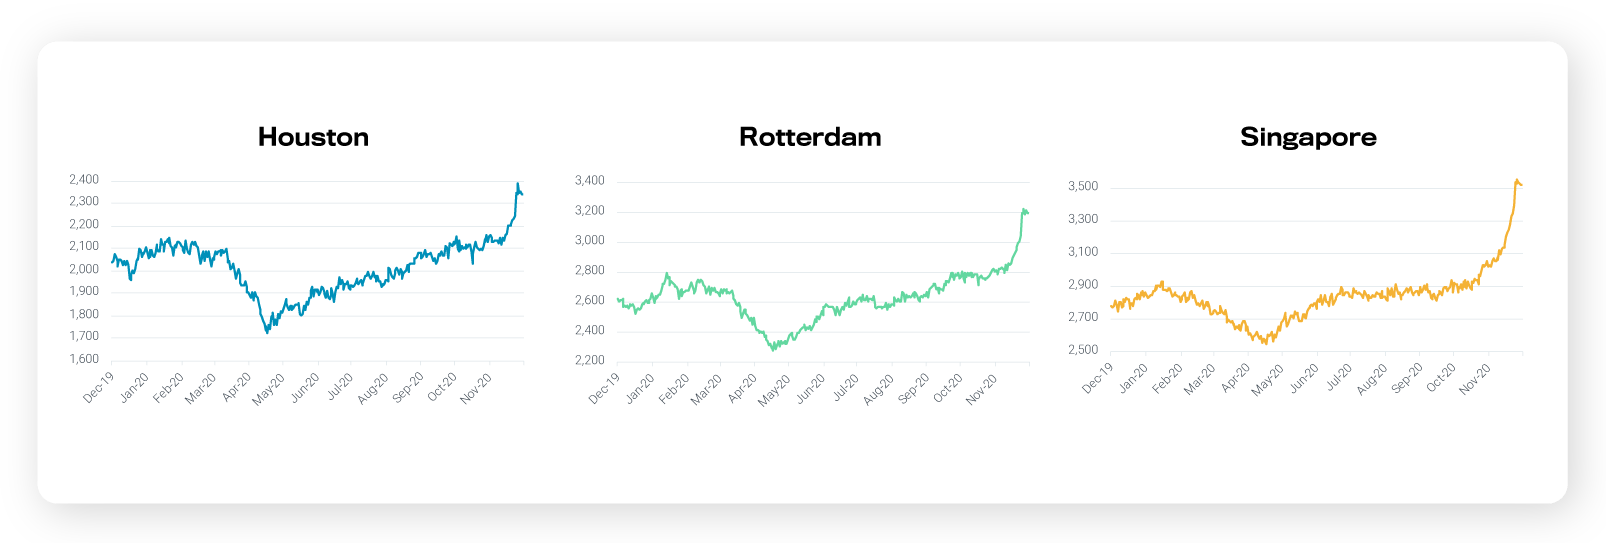
Vortexa’s vessel availability data for the next 35 days shows that tanker supply is rising across major freight routes around the world. Benchmark freight supply for key vessel classes at the trading hubs of Houston, Rotterdam and Singapore has recently grown sharply. We take a snapshot look at each for all tanker classes.
In Houston, tanker availability across all classes is up 9% month-on-month, with clean tankers carrying the larger burden of high availability as CPP exports out of PADD 3 remain near year-lows. In Rotterdam, availability is up 14% month-on-month. Weak chartering activity recently has led to a build-up in tonnage and with the forthcoming Christmas holidays there are doubts as to whether activity will pick up. Singapore is not immune to global oversupply in the market with availability up 17% month-on-month.
Looking ahead, we expect that rising vessel availability across these 3 global routes will combine with tepid demand to confirm that the start of the new year will feel like 2020’s hangover is still present.

Review the year in Freight – Vortexa Analysis
2020 Vortexa Special Reports/Infographics feat. Freight
- November: The Interwoven Global Tanker Trade: A Venezuela case study
- October: Infrographic: CPP Flows & Freight – October 2020 Snapshot
- August: Top 10 Freight Market Trends
- July: Shadow of Venezuela visits hangs over tanker industry
2020 Vortexa Blogs feat. Freight
- November 20: LR tankers buoyed by Asian petchem crackers
- October 7: ‘Catch 22′ for crude tanker markets
- September 24: West of Suez gasoline flows pick up in a low-freight environment
- September 10: Lower Black Sea crude loadings at to tanker market woes
- September 3: PADD3 tanker availability climbs post-Hurricane
- August 26: All eyes remain on floating storage for tanker markets
- August 20: VLCC utilisation falls to yearly lows
- July 29: Clean VLCC loading activity peaks in July
- July 14: Mediterranean Aframax rates enter summer lull in the doldrums
- June 25: Firm appetite holds for North Sea crude
- June 17: Will fuel oil tankers remain afloat?
- June 10: Spot tonnage rises as floating storage unwinds
- June 2: LR2 tankers switch it up
- May 19: Scrubbers continue to buoy returns for owners, but for how long?
Want to know more about our leading freight indicators?
{{cta(‘bed45aa2-0068-4057-933e-3fac48417da3’)}}